
Simi
-
Content count
24 -
Joined
-
Last visited
Posts posted by Simi
-
-
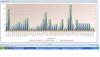
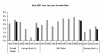
We are using stacked bar chart. Th sum displayed cuts off. Please see the xml and attachment
<chart caption="" subCaption="" slantLabels="0" rotateLabels="0" showToolTip="1" stack100Percent="1" animation="1" yAxisName="" xAxisName="Status" bgColor="" baseFontColor="" formatNumberScale="0" numberPrefix="" xAxisMinValue="0" xAxisMaxValue="2" numberSuffix="" yAxisMinValue="0" yAxisMaxValue="2" palette="5" showSum="1" baseFontSize="" baseFont="" showValues="0" rotateValues="0" showLegend="1" legendPosition="Bottom" labelDisplay="Wrap" decimalSeparator="." thousandSeparator="," placeValuesInside="1" decimals="0" formatNumber="1" useRoundEdges="0" showAboutMenuItem="1" aboutMenuItemLabel="" aboutMenuItemLink= "" showLabels="1" showBorder="1" canvasBorderThickness="1" canvasBorderColor="999999" showExportDataMenuItem="1" exportEnabled="1" exportAtClient="1" exportHandler="fcExporter89600239635170" unescapeLinks="0" > <categories><category name='Approved - Not Started' tooltext="Approved - Not Started"/><category name='Closed' tooltext="Closed"/><category name='Hold' tooltext="Hold"/><category name='In Progress' tooltext="In Progress"/><category name='Proposed' tooltext="Proposed"/><category name='Ready for Review' tooltext="Ready for Review"/></categories><dataset seriesName="% Complete" showValues="0" ><set value="100.0" link=" javascript:viewDrillDownBarDetails(979041417, 1226046662)" /><set value="801.08" link=" javascript:viewDrillDownBarDetails(979041417, 1226046662)" /><set value="0.0" link=" javascript:viewDrillDownBarDetails(979041417, 1226046662)" /><set value="3313.63" link=" javascript:viewDrillDownBarDetails(979041417, 1226046662)" /><set value="11773.3" link=" javascript:viewDrillDownBarDetails(979041417, 1226046662)" /><set value="200.0" link=" javascript:viewDrillDownBarDetails(979041417, 1226046662)" /></dataset><dataset seriesName="Actual Cost" showValues="0" ><set value="785.0" link=" javascript:viewDrillDownBarDetails(979041417, 1226046662)" /><set value="20137.5" link=" javascript:viewDrillDownBarDetails(979041417, 1226046662)" /><set value="0.0" link=" javascript:viewDrillDownBarDetails(979041417, 1226046662)" /><set value="121451.0" link=" javascript:viewDrillDownBarDetails(979041417, 1226046662)" /><set value="531343.0" link=" javascript:viewDrillDownBarDetails(979041417, 1226046662)" /><set value="5880.0" link=" javascript:viewDrillDownBarDetails(979041417, 1226046662)" /></dataset><dataset seriesName="Estimated Cost" showValues="0" ><set value="40650.0" link=" javascript:viewDrillDownBarDetails(979041417, 1226046662)" /><set value="20000.0" link=" javascript:viewDrillDownBarDetails(979041417, 1226046662)" /><set value="2600.0" link=" javascript:viewDrillDownBarDetails(979041417, 1226046662)" /><set value="644850.0" link=" javascript:viewDrillDownBarDetails(979041417, 1226046662)" /><set value="4060283.0" link=" javascript:viewDrillDownBarDetails(979041417, 1226046662)" /><set value="61150.0" link=" javascript:viewDrillDownBarDetails(979041417, 1226046662)" /></dataset><dataset seriesName="Hours Budget" showValues="0" ><set value="141.0" link=" javascript:viewDrillDownBarDetails(979041417, 1226046662)" /><set value="292.0" link=" javascript:viewDrillDownBarDetails(979041417, 1226046662)" /><set value="320.0" link=" javascript:viewDrillDownBarDetails(979041417, 1226046662)" /><set value="7328.0" link=" javascript:viewDrillDownBarDetails(979041417, 1226046662)" /><set value="45275.0" link=" javascript:viewDrillDownBarDetails(979041417, 1226046662)" /><set value="60.0" link=" javascript:viewDrillDownBarDetails(979041417, 1226046662)" /></dataset><dataset seriesName="Elapsed (Days)" showValues="0" ><set value="227.0" link=" javascript:viewDrillDownBarDetails(979041417, 1226046662)" /><set value="316.0" link=" javascript:viewDrillDownBarDetails(979041417, 1226046662)" /><set value="509.0" link=" javascript:viewDrillDownBarDetails(979041417, 1226046662)" /><set value="3803.0" link=" javascript:viewDrillDownBarDetails(979041417, 1226046662)" /><set value="15637.0" link=" javascript:viewDrillDownBarDetails(979041417, 1226046662)" /><set value="112.0" link=" javascript:viewDrillDownBarDetails(979041417, 1226046662)" /></dataset><styles><definition><style type="font" font="" name="DataValuesFontColor" color="" size="" /><style name="AxisFontColor" type="font" color="" /><style name="LabelFont" type="font" color="" bgColor="FFFFFF" bold="1" /><style name="myHTMLFont" type="font" isHTML="0" /></definition><application><apply toObject="XAxisName" styles="AxisFontColor" /><apply toObject="YAxisName" styles="AxisFontColor" /><apply toObject="Legend" styles="LabelFont" /><apply toObject="DataValues" styles="DataValuesFontColor" /><apply toObject="TOOLTIP" styles="myHTMLFont" /></application></styles></chart>

-
Hi,
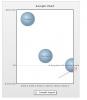
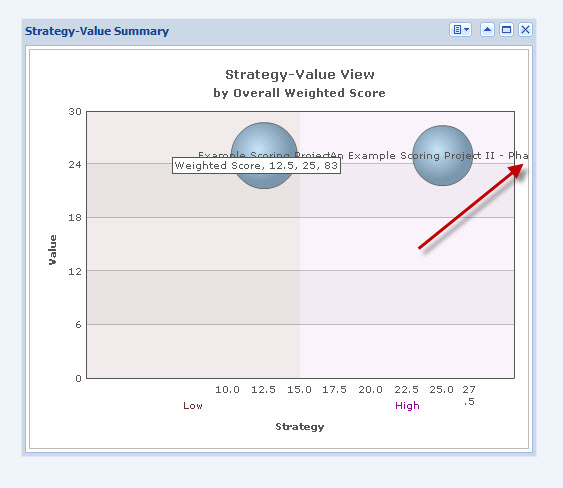
I have a set of X Axis values starting from 0 to 100 and corresponding Y Axis And Z (size) values to plot Bubble chart.
I have set the attribute 'xAxisminvalue' to 40 and 'xAxismaxvalue' to 80. But this will not restrict the bubbles ranging from 0 to 40 and 80 to 100 from displaying.
Is there any way I can make this possible?
Thanks,
Simi
-
Hi,
Glad to know that this can be viewed in 2D format also using other swfs.
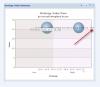
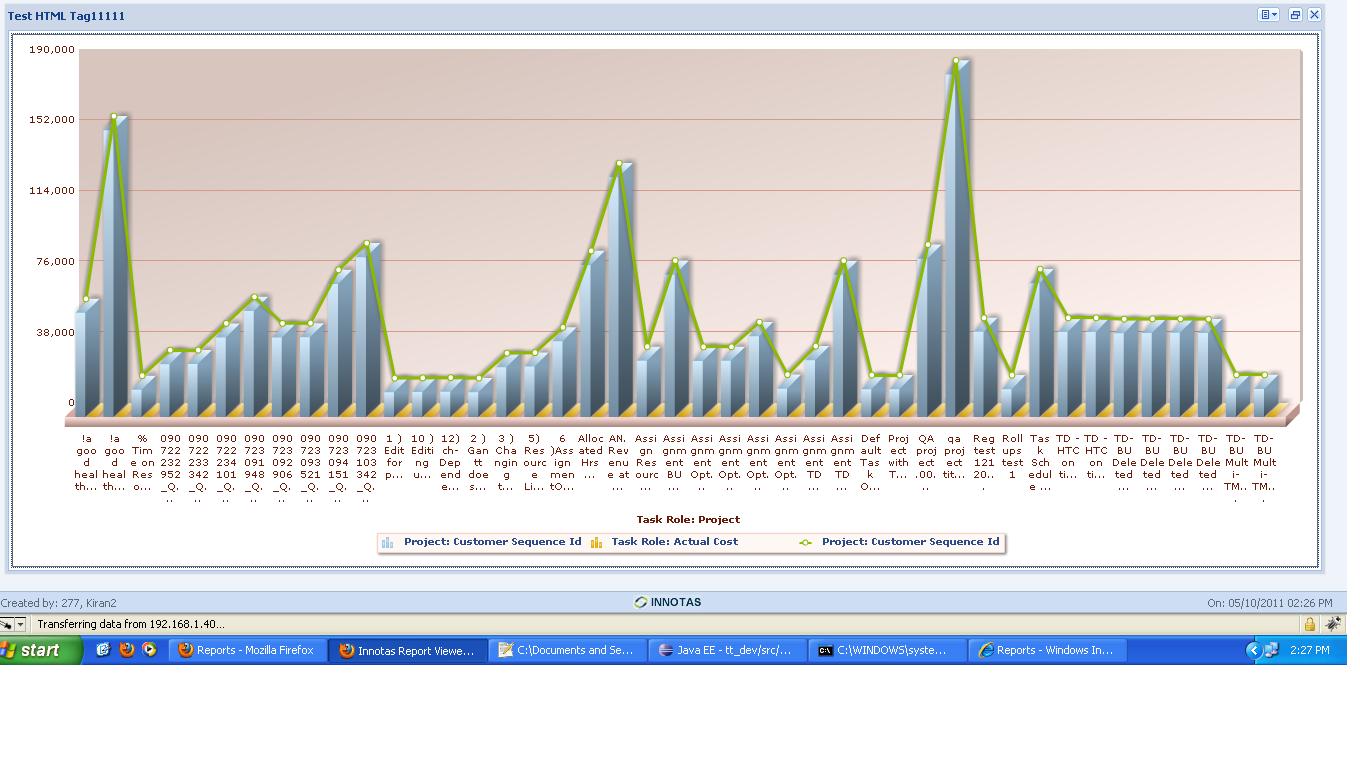
But one question is still pending. Is it possible to display the same time series chart which i have attached in the horizontal manner.
Regards,
Simi
Hi,
Please try using "2D (Single Y) Combination Chart" to solve your purpose.
Please check with the attached XML for your detailed reference.
For further details on the XML configuration, please refer to the following link.
http://www.fusioncha...SS/Combi2D.html
Hope this helps.

-
Hi,
Here i am sttaching the image for Time Series Chart.
I just want to know whether it is possible to display this chart Horizontally and is it possible to show the chart in 2D format ?
Regards,
Simi
Hi,
Glad that issues are resolved.
Please feel free to revert in case you have any queries.
Happy FusionCharting!
-
Yes, This will do it for me
Thanks for the quick response.
Regards,
Simi
Hi,
Thanks for your response.
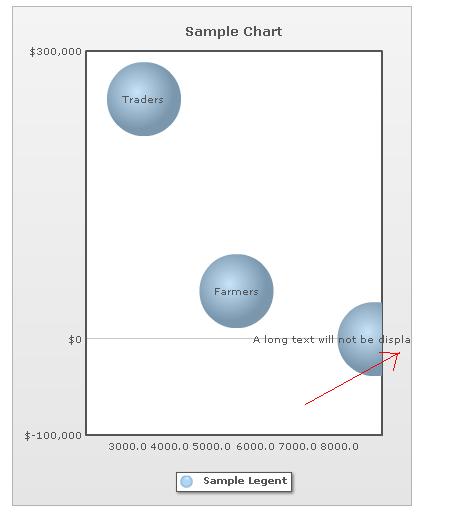
Please try the same by using {br} inside the chart text.
For ex: <set name='A long text{br}will not be {br}displayed{br} completely' />
Hope this helps.

-
Hi,
Here i am attching the new bubbe chart and its corresponding XML.
Thanks,
Simi
Hi,
Thanks for your post.
Could you please send us the XML code to test it from our end?
Awaiting for your response.
-
Hi,
I have an issue with bubble chart. If the title is so big, in the mouse over the title gets off side.
How can we display it completely ?
Thanks and Regards
Simi
-
Hi,
First i would like to say a big thanks.....
Thanks a lot...Simple but effective...i will attach the screen shots later for those queries that were a bit confused.
Thanks and Regards
Simi
Hi,
>> In case you are looking for the support to the attribute "useRoundEdges" in Column 3D chart, I am afraid, FusionCharts does not support this, as of now.

>> Please confirm if you are trying to create a Bar 3D chart. Please note that FusionCharts does not support Single-series Bar 3D chart.
However, you can create the same using Multi-series Bar 3D chart using only single <dataset> element with the attribute "showLegend" set to '0'.
>> I am afraid, Pareto chart cannot be displayed horizontally as a Bar chart, as of now.

>> Please note that Single -series charts (except Pie chart) does not support Legend. Hence, any attributes related to legend would not be functional.
>> Could you please specify this a bit elaborately?
>> Yes. This is the functional feature of Pareto chart which cannot be changed/modified.
>> Yes. Pareto charts are Single-series charts.
>> I am afraid, I am unable to understand the query. Please specify the issue a bit elaborately.
>> Please explain the requirement a bit elaborately with a screenshot of the same.
Hope this helps.
 Looking forward to your feedback.
 -
Hi Thanks a lot....
But i am still stuck at the point you mentioned
Please note that 2D and 3D charts are completely different charts built with different functionality. You can view 3D charts in 2D mode but the reverse is not possible.
How can we see a 3D chart in the 2D format?
Thanks and Regards
Simi
Hi,
>> Please note that in case you are looking for charts that supports time format or realtime charts, then I am afraid, none of the above charts supports either of the feature.
Time format is not supported by FusionCharts and realtime are charts are available in the FusionWidgets pack.
In case you are looking for something else, please send us the screenshot of your requirement.
>> Please note that 2D and 3D charts are completely different charts built with different functionality. You can view 3D charts in 2D mode but the reverse is not possible.
In case you are looking for Stacked Column chart in 3D mode, please try using Stacked Column 3D chart. More at:
http://www.fusioncha...SS/StCol3D.html
>> Yes. The SWFs with the name "Column" would render the dataplots vertically whereas the "Bar" charts would render the same horizontally with the same data even.
Hope this helps.
-
Hi Al,
Here is the list of dependency issues i could find in the column chart. I have to mail this to the client as soon as possible. So can anyone this is true or false ?
Dependency Issues
1. If the Dimension is 3D Chart Type Cylinder does not work.
2. If the orientation is Horizontal Dimention 3D does not work for Simple Column Chart
3. If the option Pareto is Yes Orientation Horozontal will not work.
4. For Simple Column charts Legend Position , Legend Font Color and Legent Percent should not be applicable (Since there is no Legend for Simple charts)
5. No Horizontal view for Time Series Charts.
6. Secondary Y Axis is applicable only to Pareto Charts and it will be displayed in % value only, cannot be able to change.
7. Pareto is applicable only if the it is a Simple Series Chart
8. Pareto is applicable only if the Target Line is not selected.
9. No 2D for Multiseries Time Series Chart (Available only MSColumnLine3D.swf)
-
Hi,
Can anyone list down the different types of Font Families supported by Fusion Chart..
Thanks,
Simi
-
Yes, Thanks for your valuable comments

-
Hi,
Can anybody tell me what would be the default value for the chart option Label Display? Stagger, Rotate or Wrap.
Regards,
Simi
-
Hi Thanks for the help.
Regarding the Question number 2
I am using the swfs MSColumnLine3D.swf, StackedColumn2DLine.swf and StackedColumn3DLine.swf.
1. From the Name of the swfs it can be seen that Stacked Column can be showed in 2D and 3D but no 3D for Multiseries Column. Is it true ?
2. Do we have any swfs like MSBarLine3D.swf or StackedBar2DLine.swf or StackedBar2DLine.swf
I hope the SWF's with the name Column will render the chart Vertically and with the name Bar will render the chart Vertically. Is it true ?
Regsrds,
Simi
-
Hi,
I have some doubts regarding the followings
1. Is the attribute 'useRoundEdges' available for 3D chart ?
2. Can we display TimeSeries chart Horizontally ?
3. Is 3D option available in Single Series Bar chart(Horizontal Display) ? It is available in Single Series Column chart(Vertical display)
Thanks ,
Simi
-
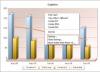
I have created a bar with the following xml string
<chart caption='' subCaption='' showToolTip='1' animation='1' yAxisName='' xAxisName='' bgColor='FFFFFF' baseFontColor='' formatNumberScale='0' numberPrefix='' numberSuffix='' yAxisMinValue='' yAxisMaxValue='' palette='5' >
<set label='Account : Bug ...' value='1' link='javascript:parent.viewDrillDownBarDetails(2405041)' />
</chart>
The generated chart shows double values on Y Axis.
Can you point out the error in my xml
-
is there any restriction in the number of bubbles that can be shown?
-
Bubble Chart Can we set the layout to Horizontal or vertical.
-
Hi,
Can we set the order of Fusion Chart Context Menu as follows
- Print Chart
- Create PDF
- Create JPEG
- Create PNG
- Copy Data to Clipboard
-
Hi
Can we remove the Flash related links from Fusion chart context menu
-
Hi
We need a similar chart
Hi,
Welcome to FusionCharts Forum!
Could you please elaborate your query?
It will be helpful, if you could send us a screenshot of your requirement.
-
Can we have multiple groupings on X Axis
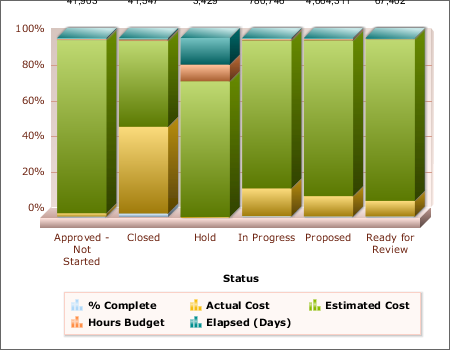


stacked bar chart sum displayed cuts off
in General usage
Posted · Edited by Simi · Report reply
Hi Vishalika,
This is what i need .Could you please let me know the issue with my xml. Also one more doubt i am using 3D chart is there any difference in that.