
RMG_85
-
Content count
24 -
Joined
-
Last visited
Posts posted by RMG_85
-
-
Hello,
I have a chart that is being rendered with Javascript. However, when I do an AJAX postback, the chart disappears. Please can you point me to an example of using a javascript chart in C# .Net and performing an AJAX update of the chart data?
Many thanks.
-
Okay, here is my chart XML:
<chart showValues='0' bgAlpha='100' bgColor='FFFFFF' showBorder='0' chartLeftMargin='10' chartRightMargin='20' chartTopMargin='10' chartBottomMargin='10' outCnvbaseFont='Trebuchet MS' outCnvBaseFontSize='12' outCnvbaseFontColor='000000' baseFontColor='000000' useRoundEdges='1' canvasbgAlpha='50' legendBgAlpha='70' showPercentageValues='0' showToolTip='0' inThousandSeparator=',' formatNumberScale='0' showLabels='1' enableSmartLabels='1' decimals='1' canvasBorderAlpha='30' showLegend='0' yAxisName='Score' imageSave='1' imageSaveURL='/Sociview/Common/Handlers/FusionChartImageSave_v3.ashx'><categories><category label='Jan' x='1' showVerticalLine='1' /><category label='Feb' x='2' showVerticalLine='1' /><category label='Mar' x='3' showVerticalLine='1' /><category label='Apr' x='4' showVerticalLine='1' /><category label='May' x='5' showVerticalLine='1' /><category label='Jun' x='6' showVerticalLine='1' /></categories><dataset drawLine='1' seriesName='Values'><set x='5.77' y='20' /><set x='5.87' y='20' /></dataset><styles><definition><style name='captionFont' type='font' font='Arial' size='12' color='000000' bold='1' letterSpacing='1' /></definition><application><apply toObject='Caption' styles='captionFont' /><apply toObject='subCaption' styles='captionFont' /></application></styles></chart>
And attached is an image of the chart it is generating. Please can you explain why your graph shows all the month labels but mine does not? What setting makes all the months display?
-
Yes, this works correctly thank you. I assume this is the version I would get if I downloaded the latest licenced version of the files from the Product Update Centre?
-
I am using the multi-series 2d line chart.
-
Sorry, can you attach the swf flash files, not the js files?
-
In previous problems I have posted to these boards, you have attached updated files for me to use. I am asking if you can attach the swf file your example uses so I can see if that file fixes my problem.
-
Are you able to attach the swf file you are using, in case it is a problem with the files I downloaded?
-
XML is as follows:
<chart showValues='0' bgAlpha='100' bgColor='FFFFFF' showBorder='0' chartLeftMargin='10' chartRightMargin='20' chartTopMargin='10' chartBottomMargin='10' outCnvbaseFont='Trebuchet MS' outCnvBaseFontSize='12' outCnvbaseFontColor='000000' baseFontColor='000000' useRoundEdges='1' canvasbgAlpha='50' legendBgAlpha='70' showPercentageValues='0' showPercentInToolTip='0' inThousandSeparator=',' formatNumberScale='0' showLabels='1' enableSmartLabels='1' decimals='1' canvasBorderAlpha='30' interactiveLegend='1' yAxisName='Sentiment' caption='Sentiment History' imageSave='1' imageSaveURL='/Sociview/Common/Handlers/FusionChartImageSave_v3.ashx'><categories><category label='May 2011' /></categories><dataset seriesName='Twitter'><set value='53' /></dataset><dataset seriesName='Facebook'><set value='57' /></dataset><dataset seriesName='YouTube'><set value='56' /></dataset><styles><definition><style name='captionFont' type='font' font='Arial' size='12' color='000000' bold='1' letterSpacing='1' /></definition><application><apply toObject='Caption' styles='captionFont' /><apply toObject='subCaption' styles='captionFont' /></application></styles></chart>
-
I am using v3.2, and the interactive legend is working for the multi bar chart but not the multi line chart...
-
Hello, I have a quick question about the Interactive legend feature: Is it possible to use this on a line chart? I tried setting interactiveLegend="1" but the legend did not become interactive.
-
How strange. Is there a chart setting that controls whether or not all the categories are displayed? For example, because all the data points fall after the 'last' category point, is there a setting hat would only show from that point onwards? And if so, how would I turn that setting off?
-
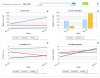
Please see attached screenshot - this is an example scatter chart I built, showing X-axis labels. The XML is as follows:
<chart showValues='1' bgAlpha='100' bgColor='FFFFFF' showBorder='1' chartLeftMargin='10' chartRightMargin='20' chartTopMargin='10' chartBottomMargin='10' outCnvbaseFont='Trebuchet MS' outCnvBaseFontSize='12' outCnvbaseFontColor='000000' baseFontColor='000000' useRoundEdges='1' canvasbgAlpha='50' legendBgAlpha='70' imageSave='1' imageSaveURL='/VolumeChartingExample/Common/Handlers/FusionChartImageSave_v3.ashx'><categories><category label='Apr' x='1' showVerticalLine='1' /><category label='May' x='2' showVerticalLine='1' /><category label='Jun' x='3' showVerticalLine='1' /></categories><dataset drawLine='1' seriesName='1'><set x='0.5' y='10' /><set x='2.5' y='15' /></dataset><dataset drawLine='1' seriesName='2'><set x='1.5' y='30' /><set x='3.5' y='20' /></dataset><styles><definition><style name='captionFont' type='font' font='Arial' size='12' color='000000' bold='1' letterSpacing='1' /></definition><application><apply toObject='Caption' styles='captionFont' /><apply toObject='subCaption' styles='captionFont' /></application></styles></chart>
So if scatter chart does not display X-axis labels, why does this scatter chart displays labels? And why does the the first XML I posted not display labels?

-
Hi,
I have a scatter chart but the x-axis labels are not displaying. Here is the xml:
<chart showValues='0' bgAlpha='100' bgColor='FFFFFF' showBorder='0' chartLeftMargin='10' chartRightMargin='20' chartTopMargin='10' chartBottomMargin='10' outCnvbaseFont='Trebuchet MS' outCnvBaseFontSize='12' outCnvbaseFontColor='000000' baseFontColor='000000' useRoundEdges='1' canvasbgAlpha='50' legendBgAlpha='70' showPercentageValues='0' showToolTip='0' inThousandSeparator=',' formatNumberScale='0' showLabels='1' enableSmartLabels='1' decimals='1' canvasBorderAlpha='30' xAxisName='Time' yAxisName='Score' imageSave='1' imageSaveURL='/Sociview/Common/Handlers/FusionChartImageSave_v3.ashx'><categories><category label='Dec' x='1' showVerticalLine='1' /><category label='Jan' x='2' showVerticalLine='1' /><category label='Feb' x='3' showVerticalLine='1' /><category label='Mar' x='4' showVerticalLine='1' /><category label='Apr' x='5' showVerticalLine='1' /><category label='May' x='6' showVerticalLine='1' /></categories><dataset drawLine='1' seriesName='Values'><set x='6.63' y='61' /><set x='6.67' y='61' /><set x='6.7' y='61' /><set x='6.73' y='61' /><set x='6.77' y='61' /><set x='6.8' y='61' /></dataset><styles><definition><style name='captionFont' type='font' font='Arial' size='12' color='000000' bold='1' letterSpacing='1' /></definition><application><apply toObject='Caption' styles='captionFont' /><apply toObject='subCaption' styles='captionFont' /></application></styles></chart>
Please could you let me know if I'm missing something?
Thanks.
-
Right. Attached is a screenshot of the javascript version of the charts.
Surely I must be using the licenced version of the javascript charts because I am able to turn off the credits display when I force the charts to render as javascript (not as fallback), I just don't know how to turn off the credits when they are being used as a fallback.
-
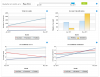
We are using a number of graphs in our website, please see attached screenshot.
-
Okay, what exactly do I need to take a screenshot of?
-
Okay. I am using a licenced version. What now?

-
Sorry, that's not what I meant. I know how to use the javascript charts as a fallback, and I know how to remove the highcharts credits, but I cannot work out how to make BOTH theses things work at the same time. In other words, when the fallback charts are used I want to make sure the credits doesn't display.
-
Hello there,
I want to turn off the 'credits' link that displays on the JavaScript version charts. I found instrctions on how to do that at the following URL:
http://www.highcharts.com/ref/#credits
When I force the charts to render in JavaScript, I can successfully add in JavaScript in to turn off the credits.
However, I run into a problem when I specify that JavaScript should be used as a fallback only. I cannot figure out how to specify both that JavaScript should be used as a fallback when Flash is not available, and ALSO ensure that the JavaScript graphs don't display the credits link. I can only seem to get one or the other condition working, never both at the same time.
Any help would be much appreciated.
-
Thank you. This has resolved the issue.
-
Sorry, I don't see any file attached...?
-
I am using v3.2.1 - is this the latest version?
-
Hello,
I have a number of charts on my web page, with both the Flash and the JS versions working perfectly. However, one of my charts displays in Flash, but in JS mode says "chart has no javascript fallback". I'm not sure why this is happening, as it is a SingleSeries Bar2D chart. Here is the javasacript for it:
<script type="text/javascript"> <!-- FusionCharts.setCurrentRenderer('javascript'); var strXML = "<chart showValues='0' bgAlpha='100' bgColor='FFFFFF' showBorder='0' chartLeftMargin='10' chartRightMargin='25' chartTopMargin='10' chartBottomMargin='10' outCnvbaseFont='Trebuchet MS' outCnvBaseFontSize='11' outCnvbaseFontColor='000000' baseFontColor='000000' useRoundEdges='0' canvasbgAlpha='50' legendBgAlpha='70' showPercentageValues='0' showPercentInToolTip='0' inThousandSeparator=',' formatNumberScale='0' showLabels='1' borderColor='#474747' decimals='0' animation='1' canvasBorderAlpha='30' canvasBgColor='FFFFFF' canvasBgAlpha='0' divLineAlpha='50' showYAxisValues='1' showAlternateVGridColor='0' outCnvBaseFont='Trebuchet MS' outCnvBaseFontColor='#474747' plotSpacePercent='50' showShadow='0' plotFillAlpha='90' plotGradientColor='F6F6F6' plotBorderColor='7A7A7A' imageSave='1' imageSaveURL='/Common/Handlers/FusionChartImageSave_v3.ashx'><set label='Official' value='81' link='/Main/Reports/QuickStats.aspx?classification=Official%2526socialplatform=1' /><set label='Unofficial' value='1199' link='/Main/Reports/QuickStats.aspx?classification=Unofficial%2526socialplatform=1' /><set label='Endorsed' value='28' link='/Main/Reports/QuickStats.aspx?classification=Endorsed%2526socialplatform=1' /><set label='Other' value='25' link='/Main/Reports/QuickStats.aspx?classification=Other%2526socialplatform=1' /><styles><definition><style name='captionFont' type='font' font='Arial' size='12' color='000000' bold='1' letterSpacing='1' /></definition><application><apply toObject='Caption' styles='captionFont' /><apply toObject='subCaption' styles='captionFont' /></application></styles></chart>"; var myChart = new FusionCharts("/Common/Flash/FusionCharts_v3/bar2D.swf","ctl00_cphPlaceholder_smAccountClassificationChart1_pnlChartContainer_chart" , "300", "120", "0", "0"); myChart.setXMLData(strXML); myChart.render("ctl00_cphPlaceholder_smAccountClassificationChart1_pnlChartContainer"); // --> </script>
Any help would be much appreciated.


Javascript Chart Ajax Postback Problem
in Javascript Problems
Posted · Edited by RMG_85 · Report reply
What if I have inserted my chart into the page using JavaScript like this:
<script type="text/javascript">
FusionCharts._fallbackJSChartWhenNoFlash(); var strXML = "<chart showValues='0' bgAlpha='100' bgColor='FFFFFF' showBorder='0' chartLeftMargin='10' chartRightMargin='20' chartTopMargin='10' chartBottomMargin='10' outCnvbaseFont='Trebuchet MS' outCnvBaseFontSize='12' outCnvbaseFontColor='000000' baseFontColor='000000' useRoundEdges='1' canvasbgAlpha='50' legendBgAlpha='70' showPercentageValues='0' showPercentInToolTip='0' inThousandSeparator=',' formatNumberScale='0' showLabels='1' enableSmartLabels='1' decimals='1' canvasBorderAlpha='30' xAxisName='Month' yAxisName='Number of accounts' caption='Total Accounts' imageSave='1' imageSaveURL='/Common/Handlers/FusionChartImageSave_v3.ashx'><categories><category label='Apr 2011' /><category label='May 2011' /><category label='Jun 2011' /></categories><dataset seriesName='YouTube' color='ff3333' alpha='100'><set value='640' /><set value='594' /><set value='601' /></dataset><dataset seriesName='Facebook' color='3b5998' alpha='100'><set value='68' /><set value='112' /><set value='127' /></dataset><dataset seriesName='Twitter' color='5599bb' alpha='100'><set value='875' /><set value='2538' /><set value='2832' /></dataset><styles><definition><style name='captionFont' type='font' font='Arial' size='12' color='000000' bold='1' letterSpacing='1' /></definition><application><apply toObject='Caption' styles='captionFont' /><apply toObject='subCaption' styles='captionFont' /></application></styles></chart>"; var myChart = new FusionCharts("MSLine.swf","pnlChartContainer_chart", "450", "300", "0", "0"); myChart.setXMLData(strXML); myChart.render("pnlChartContainer"); </script>
And the user does not have flash installed? I have tried many things, including calling the following on postback with the updated strXML
myChart.setXMLData(strXML); myChart.render("pnlChartContainer");
But of all the different ways I have tried, either no graph displays or it displays but with the old XML data, even though the XML in the page has been updated. How do I do the AJAX update when the chart has been rendered in this way?