
findstar
-
Content count
4 -
Joined
-
Last visited
Posts posted by findstar
-
-
Thanks your reply.
I try to set labeldisplay='none' then that work!
labeldisplay='none' and rotateLabels='0' then labal don't display vertical.
Thanks your help.
Hi,
I'm afraid, I'm unable to replicate the issue.
Since the "labelDisplay" attribute option is set to a default value 'AUTO'
AUTO mode which means that the alignment of the data labels is determined automatically depending on the size of the chart. This would override the rotatelabels attribute when set to 0 because of the width of the chart is less to accommodate the X-axis data labels.
Could you try once increasing the width of the chart or set the "labelDisplay" attribute to "NONE" and "rotateLabels" to 0 ?
I hope this helps.

-
Other issue is charts option 'rotateLabels'
rotateLabels='0' option don't work.
please check this too.
Hi,
We are looking into this and shall update you as soon as we fix this issue.
Thank you for your continued patience and patronage.
-
Hi.
I have a question about the anchor peoperties for the Multi-series Line 2D Chart
In Enterprise version Version 3.2 (I upgrade version 3.1.1-> 3.2 on today) I want to config javascript version chart
so I try to " renderer : 'JavaScript' "
like this
$('#bdichartDiv').insertFusionCharts({
swfUrl : "<?=$_URL?>/lib/FusionChartsXT/Charts/MSLine.swf?",
renderer : 'JavaScript',
dataSource : "samplebdi.php",
dataFormat : "xmlurl",
width : "100%",
height: "340",
id : "ChId1"
});
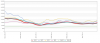
but that is some anchors is happen. I don't want to anchors but there it is.
so I test flash render and javascript render
In flash render anchor is not shown but in javascript anchors is shown.
Why is this?? I need your help.
I don't want to draw anchor..
this is my xml
<chart
showBorder="0"
showToolTip="0"
showLabels="1"
yAxisMinValue="0"
yAxisMaxValue="5000"
adjustDiv="0"
numDivLines="9"
formatNumberScale="0"
caption=""
subcaption=""
animation="0"
numberPrefix=""
lineThickness="1"
showValues="0"
drawAnchors="0"
divLineAlpha="30"
divLineColor="BBBBBB"
divLineIsDashed="0"
showAlternateHGridColor="1"
alternateHGridAlpha="10"
alternateHGridColor="BBBBBB"
shadowAlpha="20"
labelStep="20"
chartTopMargin="10"
chartLeftMargin="5"
chartRightMargin="20"
chartBottomMargin="10"
bgColor="FFFFFF"
borderColor="FFFFFF"
bgAngle="270"
bgAlpha="10,10"
canvasBorderColor="BBBBBB"
rotateNames="0"
setAdaptiveYMin="1">
<categories>
<category Name='Nov 2010' />
<category Name='Nov 2010' />
<category Name='Nov 2010' />
<category Name='Nov 2010' />
<category Name='Dec 2010' />
<category Name='Dec 2010' />
<category Name='Dec 2010' />
<category Name='Dec 2010' />
<category Name='Dec 2010' />
<category Name='Dec 2010' />
</categories>
<dataset seriesName="BDI" color="#e13b3e" lineThickness="5" >
<set value='2200' anchorRadius="0"/>
<set value='2170' anchorRadius="0"/>
<set value='2145' anchorRadius="0"/>
<set value='2099' anchorRadius="0"/>
<set value='2096' anchorRadius="0"/>
<set value='2133' anchorRadius="0"/>
<set value='2168' anchorRadius="0"/>
<set value='2179' anchorRadius="0"/>
<set value='2173' anchorRadius="0"/>
<set value='2144' anchorRadius="0"/>
</dataset>
<dataset seriesName="BCI" color="#3b74e1" anchorBorderColor="#3b74e1" >
<set value='3381' />
<set value='3233' />
<set value='3095' />
<set value='2910' />
<set value='2869' />
<set value='2919' />
<set value='2983' />
<set value='2987' />
<set value='2929' />
<set value='2832' />
</dataset>
<dataset seriesName="BPI" color="#FFCC00" anchorBorderColor="#FFCC00" >
<set value='2290' />
<set value='2330' />
<set value='2356' />
<set value='2377' />
<set value='2380' />
<set value='2385' />
<set value='2382' />
<set value='2384' />
<set value='2384' />
<set value='2386' />
</dataset>
</chart>


Drawanchors Not Work In Javascript Render
in Bug Reports
Posted · Report reply
Hi.
I found a bug at last my post on 27 September 2011 but it not fixed yet.
(http://forum.fusioncharts.com/topic/10397-drawanchors-not-work-in-javascript-render/page__p__40737__hl__anchor__fromsearch__1#entry40737)
It is about the anchor peoperties for the Multi-series Line 2D Chart
Now I use Enterprise Fusioncharts/Version 3.2.3-release.4749
In XT I want to config javascript version chart
so I try to " renderer : 'JavaScript' "
and
I config xml properties
drawAnchors="0"
or
anchorRadius="0"
but graph not change.
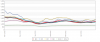
In render flash it work good
but render javascript it dont't work.
please check this anchor bug .
this is my xml file and
my render javascript source
------------------------------------------
$('#bdichartDiv').insertFusionCharts({
swfUrl : "./Charts/MSLine.swf?",
renderer : 'JavaScript',
dataSource : "bdi.xml",
dataFormat : "xmlurl",
width : "100%",
height: "340",
id : "ChId1"
});
------------------------------------------
bdi.xml