
Grapecity
-
Content count
2 -
Joined
-
Last visited
Posts posted by Grapecity
-
-
Dear Rajroop,
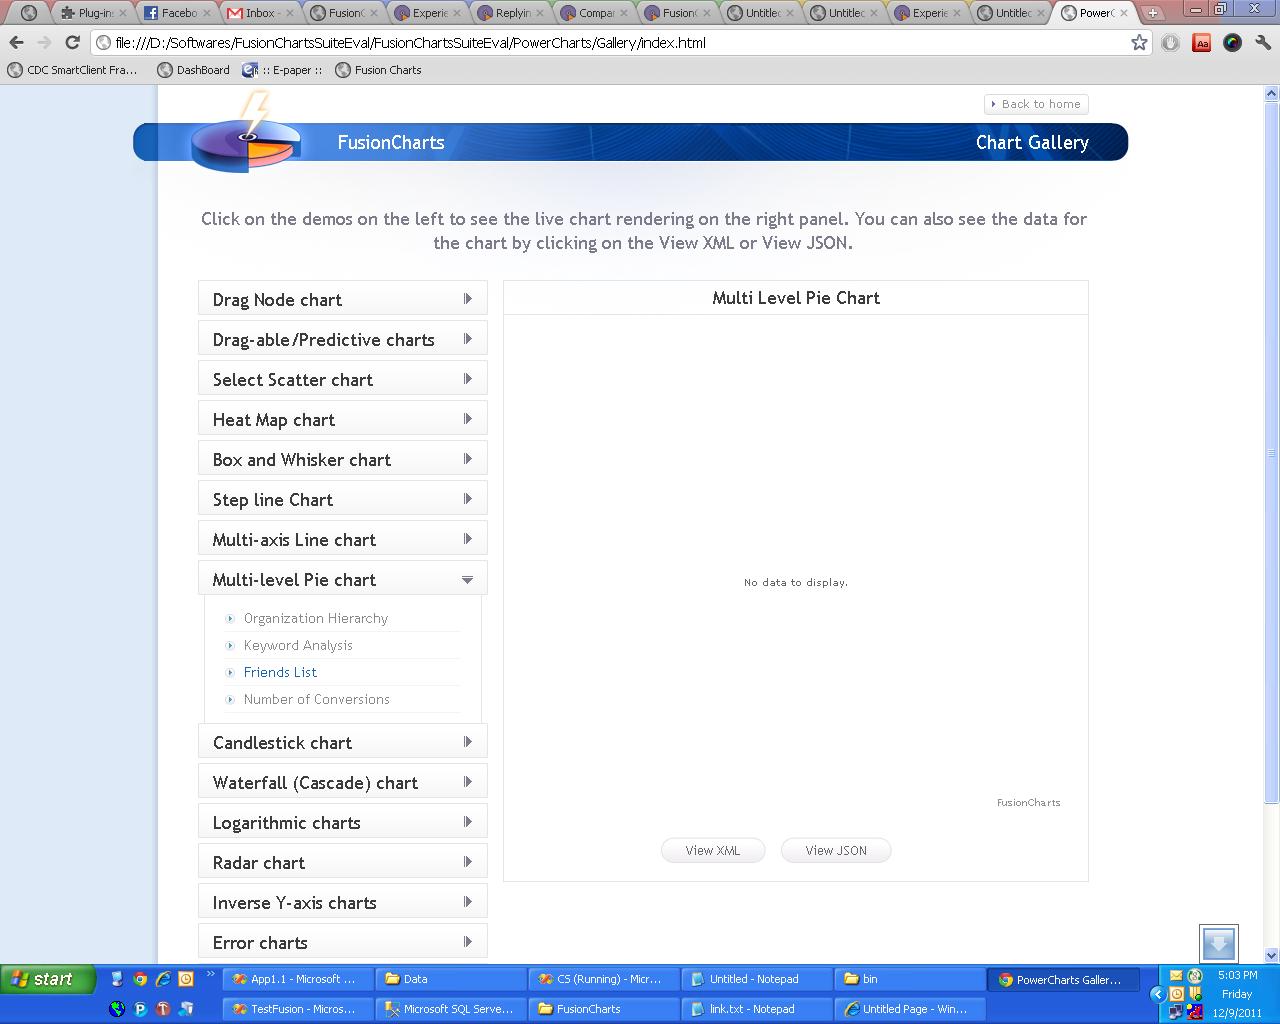
This is to inform you that i tested each and every example provided by you in the trail version of FusionCharts Suite and found only FusionCharts XT supports HTML5 & flash both. Non of the examples of PowerCharts V3.2 worked for me when flash is disabled on the browser (chrome version 15).
Is it that these are disabled for trial versions and will works only in licensed version?
or
Still there are some issues in it?
or
Will it work with next release?
Can you please tell me in detail about it because i am very keen to use these charts in my project.
Below is the screen shot
Thank you,
Sunil kumar
Dear Users,
We are delighted to announce that PowerCharts is now ready for your iPads and iPhones too. We have just released PowerCharts v3.2. Starting v3.2, PowerCharts has HighCharts embedded within it, and offers both Flash and JavaScript (HTML5) charting . The Flash charts are displayed on a majority of devices and the JavaScript charts on devices that do not support Flash, all of it without writing a line of code.
What's new in PowerCharts v3.2?
Along with the JavaScript fallback, PowerCharts v3.2 also brings a lot of other powerful capabilities including:
* Heat Map chart : We have introduced heat map chart which provides tabular representation of complex data with user-defined color ranges. It is used to plot complex data like performance comparison of different companies, periodic table, employee attendance, stock market investments and the like. Using the heat map chart from PowerCharts, you can see all data sets lying in a particular color range just by selecting it.
* Step-line chart : PowerCharts v3.2 also introduces step line chart with vertical and horizontal lines to connect data points.
* More error charts : We have added error line and error scatter chart to show the error or deviation in data using error bars in line and scatter chart. In the scatter chart, ther is option to add both horizontal and vertical error bars.
* LinkedCharts: Create drill-down charts up to unlimited levels using a single data source without writing a line of additional code. Another first in the industry.
* JSON Data Support: In addition to XML, PowerCharts now supports JSON data format making it easily work with JavaScript libraries like jQuery and ExtJS.
* Charts with smarter labels, legends and tool-tips: PowerCharts offers smarter reporting features with with interactive legend, better label management and better printing support.
* Advanced Chart Programmability: An entirely re-designed JavaScript library to include compatibility for all browsers, advanced event management, extended APIs and a highly stable model.
Learn more about everything new in PowerCharts v3.2 at http://www.fusioncha...om/PowerCharts/
Powercharts V3.2 Released
in Company News
Posted · Report reply
Hi admin,
Re-downloading also didn't worked.. Can you please tell me what is the issue in it or the files in your download are not updated.
Can you also tell me if FusionWigdets support html5 (ipad + iphone compatible)?
Thanks