gbiemer89

Members
  • Content count

    2
  • Joined

  • Last visited

Posts posted by gbiemer89


  1. Thanks for getting back to me. While that would work great for just this case, I'm looking for a more general solution. I.e. This chart is being used to display data that doesn't always have a max value of 2. Fundamentally what I'm wondering is if i have to find the max value of the chart i'm creating and then from there decide the best number of div lines (every time i render the chart) or if theres some kind of prepackaged setting I can use to make these decisions for me. Thanks a lot!!!


    Hi,


    Please note that FusionCharts display the Y-Axis values by calculating the number of DIV lines and the maximum and minimum value among the data provided to plot.


    Since your data is having maximum value '2' and the default number of DIV lines are '4', the resulted values are in decimal.


    But if you set the "divLineDecimalPrecision" attribute to '0', then the values are rounded up to the next whole numbers and results duplicate numbers.


    So, to get the result as per your requirement, you need to set the Maximum and minimum DIV line values along with the number of DIV lines.


    Ref. Code:

    <graph bgcolor='e1f5ff' caption='' subCaption=''  divLineDecimalPrecision='0' decimalPrecision='0' yaxisminvalue='0' yaxismaxvalue="5" numdivlines='4' yaxisname='' xaxisname='' numberSuffix=''>
      <set name='' value='2' color='F6BD0F'/>
      <set name='' value='1' color='FF6600'/>
      <set name='' value='2' color='8BBA00'/>
      <set name='' value='2' color='F984A1'/>
      <set name='' value='1' color='A66EDD'/>
      <set name='' value='1' color='B2FF66'/>
      <set name='' value='2' color='AFD8F8'/>
      <set name='' value='2' color='F6BD0F'/>
      <set name='' value='2' color='FF6600'/>
      <set name='' value='1' color='F984A1'/>
    </graph>


    Hope this helps!


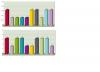
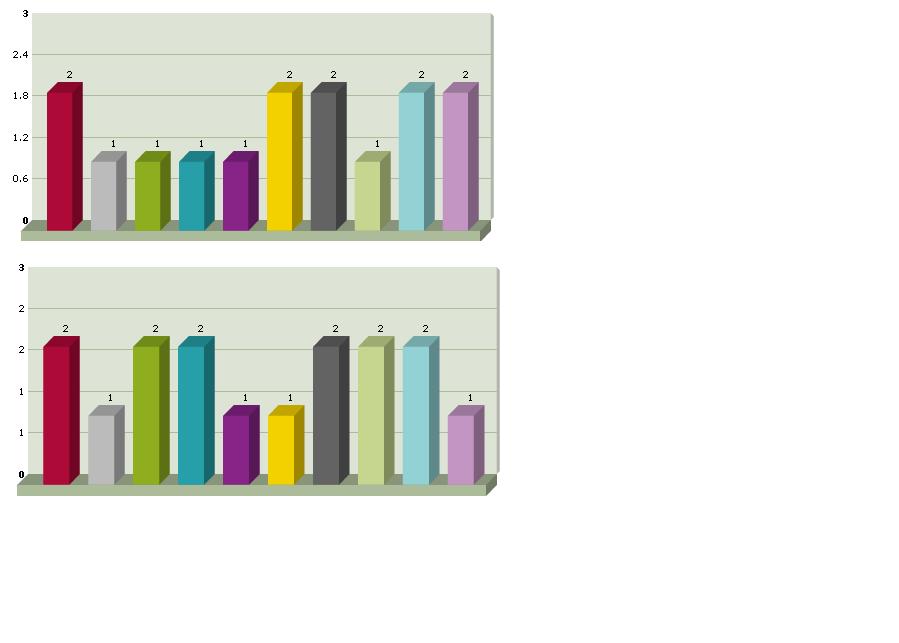
  2. I have data that I'm trying to display in a 3d bar chart and running into issues with ticks along the y axis. I would like them to display as whole numbers and not repeat. I can get the number to not repeat or I can get the numbers to be whole numbers, but I can't do both at the same time (see images). Any advice on how to handle this would be much appreciated. Thanks!!!

    post-28105-0-79795100-1336072226_thumb.jpg