
majid
-
Content count
11 -
Joined
-
Last visited
Posts posted by majid
-
-
what would be really nice feature is if I can specify an html element to be my tooltip. That way I can fully customize my tooltip as much as I want and just set the tooltip to be the html element. Then it would also be nice if there can be text replacement such as {value} or {label} that would be replaced with the displayValue of that particular datapoint.
Hi,
Adding gradient effect on tootip is not possible.
You can customize the background & border color of the tooltip.
However, you can also apply styles to make it more interactive.
For more information, read here: http://docs.fusionch...sc/ToolTip.html
Hope this helps.
-
Is it possible to create a completely custom tooltip? I want to redesign my tooltip that contains multiple back ground colors and gradients as well as images. Is possible to create such a custom tool tip?
-
First of all I would like to stay that your support on these forums is great. I also have a question about gradients. I know that plotGradientColor is for applying gradients at the chart level for all the series. But I need to specify a different gradient on each of the fills of a 2d multi-series area chart and different gradients on each column of a 2d column chart. Can you help with this?
Thanks
-
thank you. I am using the color attribute now. What I am trying to do is have a a different gradient for each of the fills in a multiseries area chart. I know that plotGradientColor defines a gradient color that is applied to all of the area fills but what if I want a different gradient for each area fill? The property plotGradientColor does not work at the dataset level. Is there a gradient attribute I can use to define a gradient at the dataset level?
Thank you
Hi,
plotFillColor attribute is applied for the complete data-plot whereas color attribute is defined for the and dataset elements for a particular data-plot or plot-area.
Hope this helps.
-
Thanks this worked perfectly. Is the 'dashed' attribute documented? I did not see it when I was looking for it in the docs.
Hi,
To achieve this you can use dashed attribute for the particular dataset.
You would need to specify this attribute under the dataset element that you want to make dashed.
Ref. Code:
<chart ... >
...
<dataset seriesName='2005' dashed='1'>
...
</chart>
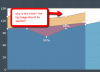
Please find attached screen-shot for your reference.
-
I get quite different colors when I use plotFillColor or color for the fill color of an area chart. Is there a difference between the two properties? Which one should I use?
-
Is it possible to have one series a dashed border and one series a solid border on a multi-series area chart. To me it seems like the property plotBorderDashed=1 only works on the chart but not on a particular series. Is there a way around this limitation?
-
Is it possible to use the annotation feature in fusionWidgets on a fusionchart area chart or a powerchart multi level pie chart? Or does the annotation feature only work on fusionWidget charts?
thanks
-
Hi,
You can use canvasBgAlpha attribute under the chart element. This attribute allows you to set transparency of the chart canvas.
Ref. Code:
<Chart ... canvasBgAlpha='0'>
Thanks this worked perfectly!
-
For some reason the background image is applied around the canvas but not on the canvas itself. as a result the chart has a white background but all around it my bg image is visible. Here is what I am using to style my chart:
//anchor styling
DrawAnchors = 1,
AnchorBgColor = "ffffff",
AnchorBorderThickness = 1,
AnchorAlpha = 100,
//gridlines
showAlternateHGridColor = 0,
divLineIsDashed = 1,
baseFontColor = "ffffff",
outCnvBaseFontColor = "fff",
showToolTip = 0,
//chart styling
showBorder = 0,
showYAxisValues = 1,
showLegend=0,
chartTopMargin= "50",
plotGradientColor=" ",
//background image
bgImage = "/Content/images/bg.png",
bgImageDisplayMode = "Tile",
How can I get the background image applied to the entire area and have no white background behind the chart (on the canvas)

Dashed Lines On Multi Series Area Chart
in General usage
Posted · Report reply
Thanks I must have overlooked that