
Neverguesswho
-
Content count
27 -
Joined
-
Last visited
Posts posted by Neverguesswho
-
-
Hi,
Before you start, you need to follow these steps:
> Copy FusionChartsExportComponent.js from Download Package > Charts folder to your server. A good location is where you have placed FusionCharts.js
> Copy FCExporter.swf from Download Package > Charts to your server. A good location is where you have placed the other chart SWF files.
> Include an instance of Exporter Component in your web page.
> Configure the chart (XML) to use this instance of export component.
You would have to create a separate div for rendering the FusionCharts Export Component. In this div, you would need to create the instance of FusionChartsExportObject as follows,
Ref. Code:
<div id="fcexpDiv" align="center">FusionCharts Export Handler Component</div>
<script type="text/javascript">
   var myExportComponent = new FusionChartsExportObject("fcExporter1", "FCExporter.swf");
   myExportComponent.Render("fcexpDiv");
</script>
Then add the necessary attributes for client side export in the XML:
Ref. Code:
<chart caption='Monthly Unit Sales' xAxisName='Month' yAxisName='Units' showValues='0' formatNumberScale='0' showBorder='0' unescapeLinks='0' exportEnabled='1' exportAtClient='1' exportFormats='PDF' exportHandler='fcExporter1'>
For more information, please refer this URL: http://docs.fusionch...ientSimple.html
Also, find attached illustration for your reference.
I followed your directions and I still got the messed up message.... So I decided to try to create a new page with the exact same ASP and it works!!! I am guessing it was something with my html that was messed up. Also I was able to get it working on another chart just by enabling the export under <chart> and I didn't even include the exportjs or swf(just thought i'd mention that). Anyways thanks again for the help!!!!!!

-
I am having the same problem.. My charts work fine in every other browser except IE....
-
Hi,
Can you please paste your sample code here?
<%@ Language=VBScript %> <!-- #INCLUDE file="FusionCharts.asp" --> <!-- #INCLUDE file="DBConn2.asp" --> <!-- #INCLUDE file="header2.asp" --> <!-- #INCLUDE file="hours.asp" --> <html> <head> <meta http-equiv="Content-Type" content="text/html; charset=utf-8" /> <title>BPC</title> <link href="../assets/ui/css/style.css" rel="stylesheet" type="text/css" /> <script type="text/javascript" src="jquery.min.js"></script> <style type="text/css"> body,html,head,div{height:100%; min-height:100%;width:100%; } </style> <script LANGUAGE="Javascript" SRC="FusionCharts.js"></SCRIPT> </head> <body bgcolor='#FFFFFF'> <table id="PgHead" width="98%" align="center" style="margin-bottom:7px;border-bottom:1px solid #AFAFA4; bgcolor:#000000"> <tbody> <tr> <td width="20%" align="left" style="color:#475B8F;font-family:'Arial Rounded MT Bold',arial;font-size:14pt;"></td> <td class="NoPrint" width="45%" align="right" style="color:#4D4D5F;font-family:arial;font-size:14pt;"> <a href="../ListRecord.asp?theFormID=96">Back</a> </td> </tr> </tbody> </table> <div id="MainContainer"> <table class="grid1" width="100%"> <tbody> <tr> <td style="height= 350%; background-color:#F6F5E6;vertical-align:top;" align="center"> <div id="chartdiv1" align="center"></div> </br></br></br> <% Dim subjectCode,subjectID,treatmentCode,baseline,count, motherID,x Dim FC,strQuery,strCategory, strValueMax, strValueMin,strValueTreat,upper, lower Dim maxFirstNum,maxSecondNum,minFirstNum,minSecondNum,fQuarter,sQuarter,tQuarter,increment subjectCode = Request.QueryString("subjectCode") Response.Write("Subject Code: " & subjectCode & "<br />") Set oConn = Server.CreateObject("ADODB.Connection") Set oRs = Server.CreateObject("ADODB.Recordset") oConn.Open strConnQuery strQuery="Select z.ID as totOutput, d.zTreatmentCode as totOutput2 from vSubjectDemographics d, zSubject z where z.zsubjectCode = d.zSubjectCode AND z.zSubjectCode = "&subjectCode&" "'get treatment and subjectID Set oRs = oConn.Execute(strQuery) if oRS.EOF OR oRs.BOF then %><h2>I am sorry but there is no record for that subject</h2> <% else subjectid = oRs("totOutput") treatmentCode = oRs("totOutput2") if treatmentCode=1 then 'figure out upper/lower bound of BP from treatment upper=140 lower=110 else upper=180 lower=141 end if strQuery="Select ID as mother from F05 where zsubjectID = "&subjectID&" " set oRs = oConn.Execute(strQuery) if oRS.EOF OR oRs.BOF then for q = 0 to 10 response.write("<br>") Next %> <h2>I am sorry but there is no data for that subject</h2> <% for q = 0 to 20 response.write("<br>") Next else motherID = oRs("mother") strQuery= "Select count(ID) as totOutput from F05C where MotherRecID = "&motherID&" "'get number of hours assessed set oRs = oConn.Execute(strQuery) count = oRs("totOutput") 'exportFormats='PDF=Export as PDF|JPG=Export as JPG' x=0 strCategory = "<chart caption = 'Blood Pressure with Treatment' PYAxisName ='Minimum Systikuc Blood Pressure (mmHg)' SYAxisName = 'Maximum Dose of Nicardiphine (mg/hr)' showYAxisValues='0' rotatelabels='0' showToolTip='1' showNames='1' showlabels='1' exportEnabled='1' exportAtClient='1' exportHandler='fcExporter1' > <categories> <category label = 'Base' />" strCategory = strCategory + "<category label = '"&hours(0)&"' showlabels='1' />" strCategory = strCategory + "<category label = '"&hours(1)&"' showlabels='1'/>" strCategory = strCategory + "<category label = '"&hours(2)&"' showlabels='1'/>" strCategory = strCategory + "<category label = '"&hours(3)&"' /> <vLine color='FF5904' Label='First Hour' />" strValueMax = "<dataset seriesName = 'Max SBP' parentYAxis = 'P' renderAs='Line' showValues='0' > <set value = '0' />" strValueMin = "<dataset seriesName = 'Min SBP' parentYAxis = 'P' renderAs='Line' showValues='0' > <set value = '0' />" strValueTreat = "<dataset seriesName = 'NICARDIPINE' parentYAxis = 'S' renderAs='Line' dashed='1'> <set value = '0' />" min=0 max=0 minFirstNum=0 maxFirstNum=0 reatFirstNum=0 while x < count if x > 3 then strCategory = strCategory + "<category label = '' />" strCategory = strCategory + "<category label=' ' />" strCategory = strCategory + "<category label=''/>" strCategory = strCategory + "<category label='"&hours(x)& "' />" end if if min=max Then MinimumDashed=1 else MinimumDashed=0 end if strQuery= "Select QB as Max, QC as Min, QG as Treatment fromF05C where OrderNb = "&x+1&" AND MotherRecID = "&motherID&" " ' get max,min,treatment set oRs = oConn.Execute(strQuery) min = oRs("Min") max = oRs("Max") treatinfo=oRs("Treatment") minSecondNum=min maxSecondNum=max treatSecondNum=treatinfo if x>3 then increment=(minSecondNum-minFirstNum)/4 fQuarter=minFirstNum+increment sQuarter=fQuarter+increment tQuarter=sQuarter+increment strValueMin = strValueMin + "<set value = '"&fQuarter&"' anchorRadius='0' tooltext=' '/>" strValueMin = strValueMin + "<set value = '"&sQuarter&"' anchorRadius='0' tooltext=' '/>" strValueMin = strValueMin + "<set value = '"&tQuarter&"' anchorRadius='0' tooltext=' '/>" increment=(maxSecondNum-maxFirstNum)/4 fQuarter=maxFirstNum+increment sQuarter=fQuarter+increment tQuarter=sQuarter+increment strValueMax = strValueMax + "<set value = '"&fQuarter&"' anchorRadius='0' toolText=' '/>" strValueMax = strValueMax + "<set value = '"&sQuarter&"' anchorRadius='0' toolText=' '/>" strValueMax = strValueMax + "<set value = '"&tQuarter&"' anchorRadius='0' toolText=' '/>" increment=(treatSecondNum-treatFirstNum)/4 fQuarter=treatFirstNum+increment sQuarter=fQuarter+increment tQuarter=sQuarter+increment strValuetreat = strValuetreat + "<set value = '"&fQuarter&"' showvalue='0' anchorRadius='0' toolText=' '/>" strValuetreat = strValuetreat + "<set value = '"&sQuarter&"' showvalue='0' anchorRadius='0' toolText=' '/>" strValuetreat = strValuetreat + "<set value = '"&tQuarter&"' showvalue='0' anchorRadius='0' toolText=' '/>" end if strValueMin = strValueMin + "<set value = '"&oRs("Min")&"' toolText='Min SBP, Hour:"&hours(x)&"'/>" strValueMax = strValueMax + "<set value = '"&oRs("Max")&"' toolText='Max SBP, Hour:"&hours(x)&"' />" strValueTreat = strValueTreat + "<set value = '"&oRs("Treatment")&"' toolText='Hour:"&hours(x)&"' />" x=x+1 minFirstNum=minSecondNum maxFirstNum=maxSecondNum treatFirstNum=treatSecondNum wend strCategory = strCategory + "</categories>" strValueMax = strValueMax + "</dataset>" strValueMin = strValueMin + "</dataset>" strValueTreat = strValueTreat + "</dataset> <trendLines> <line startvalue= '"&upper&"' color = '' displayvalue='Upper SBP Bound'/> <line startvalue= '"&lower&"' color = '' displayvalue='Lower SBP Bound'/> </trendLines></chart>" Set oRs = Nothing strCategory = strCategory + strValueMax + strValueMin + strValueTreat response.Write(strCategory) Call FC_SetRenderer("javascript") Call renderChart("MSCombiDY2D.swf","", strCategory,"BloodPressure",1300,650,"1","1") oConn.Close end if end if %> </tr> </tbody> </table> </div> <%call PageFooter()%> </body> </html> -
Hey,
What FusionCharts version are you using?
Fusioncharts XT-asp
-
So I am trying to enable the exporting feature. It allows me to download it as a jpeg or png. I want to get it to do pdf also and I don't think it is supposed to look like this.<_<Any ideas?
This is my code
"<chart caption = Export Test' PYAxisName ='MSP' SYAxisName = 'MDN' showYAxisValues='0' rotatelabels='0' showToolTip='1' showNames='1' showlabels='1' exportEnabled='1' exportShowMenuItem='1' exportFormats='PDF' exportType='PNG=Export as High Quality Image;JPG;PDF=Export as PDF File' exportatclient='1' ExportFileName='TestFile'>

-
Hi,
Possibly, this is due to the chart ID which you are passing : Call renderChart("MSCombiDY2D.swf","", strCategory,"Blood Pressure",800,600)
Can you please try once setting the id without any space (also avoid not starting with a number)?
In short the ID is better named using variable naming conventions.
Hope this helps.
Ahhh such a simple problem!

It works and thank you soooo much for your help!!!!
-
Hey,
Please check the following:
- You've copied FusionCharts.js, jquery.min.js, FusionCharts.HC.js and FusionCharts.HC.Charts.js in the right folder.
- You've included and provided the correct path of FusionCharts.js in your HTML code.
- There are any JavaScript syntax or runtime errors that might have halted the execution of FusionCharts APIs.
- Unique names are used for the chart's JavaScript variable, chart's ID and the HMTL DIV's ID?
I double check all of them and they are correct.....

-
Error Category Microsoft VBScript runtime COM Error Number -2146828275 (0x800A000D) File Name /nett/TestFiles/ATACHII/BPChart.asp Line Number 131 Brief Description Type mismatch: 'FC_SetRenderer'
Any suggestions?
I don't get this error anymore because I am using a different FusionCharts.asp file. Still the screen comes up blank with just a "Chart" text in the middle
-
Hi,
For rendering a chart in JavaScript, you would have to call FC_SetRenderer() function.
You need to call this function each time before you call renderChart function.
Ref. Code:
FC_SetRenderer( "javascript" )
Call renderChart("../../FusionCharts/Column2D.swf", "Data/Data.xml", "", "chart1", 600, 300, False, True)
Ok so this is the very end of my code
 strCategory = strCategory + "</categories>"
strValueMax = strValueMax + "</dataset>"
strValueMin = strValueMin + "</dataset>"
strValueTreat = strValueTreat + "</dataset> <trendLines> <line startvalue= '"&upper&"' color = '' displayvalue='Upper SBP Bound'/> <line startvalue= '"&lower&"' color = '' displayvalue='Lower SBP Bound'/> </trendLines></chart>"

Call FC_SetRenderer("Javascript")'this is what your telling me I should add
Set oRs = Nothing
strCategory = strCategory + strValueMax + strValueMin + strValueTreat
response.Write(strCategory)
Call renderChart("MSCombiDY2D.swf","", strCategory,"Blood Pressure",800,600)
oConn.Close
Then I get this error
Error Category Microsoft VBScript runtime COM Error Number -2146828275 (0x800A000D) File Name /nett/TestFiles/ATACHII/BPChart.asp Line Number 131 Brief Description Type mismatch: 'FC_SetRenderer'
Any suggestions?
-
Hi,
If you are rendering chart using FusionCharts ASP class method, then you would have to use its object for rendering the chart.
You can also use simple ASP method to render the chart, you don't need to create an object here.
By calling "renderchart" function, you can render the chart.
Please refer the following URL, for more information:
http://docs.fusionch...sicExample.html
Hope this helps!
so if I use the renderchart("line.swf","","strParam","chart1", 800,800) it will render it in javascript?
-
Hi,
Can you paste your entire sample code here?
Sure
<%@ Language=VBScript %> <!-- #INCLUDE file="FusionCharts.asp" --> <!-- #INCLUDE file="DBConn2.asp" --> <html > <head> <meta http-equiv="Content-Type" content="text/html; charset=utf-8" /> <title>Blood Pressure Chart</title> <link href="../assets/ui/css/style.css" rel="stylesheet" type="text/css" /> <script type="text/javascript" src="jquery.min.js"></script> <style type="text/css"> body,html,head,div{height:100%; min-height:100%;width:100%; } </style> <script LANGUAGE="Javascript" SRC="ATACHII/FusionCharts.js"></SCRIPT> </head> <body> <div class="Blood Pressure"> <% Dim subjectCode,subjectID,treatmentCode,baseline,count, motherID,x Dim FC,strQuery,Hours(27),strCategory, strValueMax, strValueMin,strValueTreat,upper, lower hours(0) = ".25" hours(1) = ".5" hours(2) = ".75" hours(3) = "1" hours(4) = "2" hours(5) = "3" hours(6) = "4" hours(7) = "5" hours(8) = "6" hours(9) = "7" hours(10) = "8" hours(11) = "9" hours(12) = "10" hours(13) = "11" hours(14) = "12" hours(15) = "13" hours(16) = "14" hours(17) = "15" hours(18) = "16" hours(19) = "17" hours(20) = "18" hours(21) = "19" hours(22) = "20" hours(23) = "21" hours(24) = "22" hours(25) = "23" hours(26) = "24" subjectCode = Request.QueryString("subjectCode") Response.Write("Subject Code: " & subjectCode & "<br />") Set oConn = Server.CreateObject("ADODB.Connection") Set oRs = Server.CreateObject("ADODB.Recordset") oConn.Open strConnQuery strQuery="Select z.ID as totOutput, d.zTreatmentCode as totOutput2 from vSubjectDemographics] d, zSubject z where z.zsubjectCode = d.zSubjectCode AND z.zSubjectCode = "&subjectCode&" "'get treatment and subjectID Set oRs = oConn.Execute(strQuery) subjectid = oRs("totOutput") treatmentCode = oRs("totOutput2") if treatmentCode=1 then'figure out upper/lower bound of BP from treatment upper=140 lower=110 else upper=180 lower=141 end if strQuery="Select ID as mother from F05 where zsubjectID = "&subjectID&" " 'get baseline and motherFormID set oRs = oConn.Execute(strQuery) motherID = oRs("mother") strQuery= "Select count(ID) as totOutput from F05C where MotherRecID = "&motherID&" "'get number of hours assessed set oRs = oConn.Execute(strQuery) count = oRs("totOutput") x=0 strCategory = "<chart caption = 'Blood Pressure with Treatment' PYAxisName ='Minimum Systikuc Blood Pressure (mmHg)' SYAxisName = 'Maximum Dose of Nicardiphine (mg)' showYAxisValues='0'> <categories> <category label = 'Base' />" strCategory = strCategory + "<category label = '"&hours(0)&"' />" strCategory = strCategory + "<category label = '"&hours(1)&"' />" strCategory = strCategory + "<category label = '"&hours(2)&"' />" strCategory = strCategory + "<category label = '"&hours(3)&"' /> <vLine color='FF5904' Label='First Hour' />" strValueMax = "<dataset seriesName = 'Max SBP' parentYAxis = 'P' renderAs='Line'> <set value = '0' />" strValueMin = "<dataset seriesName = 'Min SBP' parentYAxis = 'P' renderAs='Line'> <set value = '0' />" strValueTreat = "<dataset seriesName = 'NICARDIPINE' parentYAxis = 'S' renderAs='Line'> <set value = '0' />" 'count = 6 while x < count if x > 3 then strCategory = strCategory + "<category label = '"&hours(x)&"' />" end if strQuery= "Select QB as Max, QC as Min, QG as Treatment from F05C where OrderNb = "&x+1&" AND MotherRecID = "&motherID&" " ' get max,min,treatment set oRs = oConn.Execute(strQuery) strValueMax = strValueMax + "<set value = '"&oRs("Max")&"' />" strValueMin = strValueMin + "<set value = '"&oRs("Min")&"' />" strValueTreat = strValueTreat + "<set value = '"&oRs("Treatment")&"' />" x=x+1 wend strCategory = strCategory + "</categories>" strValueMax = strValueMax + "</dataset>" strValueMin = strValueMin + "</dataset>" strValueTreat = strValueTreat + "</dataset> <trendLines> <line startvalue= '"&upper&"' color = '' displayvalue='Upper SBP Bound'/> <line startvalue= '"&lower&"' color = '' displayvalue='Lower SBP Bound'/> </trendLines></chart>" Set oRs = Nothing strCategory = strCategory + strValueMax + strValueMin + strValueTreat response.Write(strCategory) Call renderChart("MSCombiDY2D.swf","", strCategory,"Blood Pressure",800,600) oConn.Close %> </div> </body> </html> -
Hey,
If you are rendering charts using FusionCharts ASP Class, then you can use JS embedding method.
Here, you will create FusionCharts ASP class object FC. So you would need to call the renderchart function on the FusionCharts ASP Class object "FC".
Ref. Code:
Call FC.renderchart(false)
Hope this helps!
Ok thanks but that is what I have in my code above. I was wondering if I could not use the asp class object and still render in javascript?
-
If I use the xml format, then I don't have to create the fusionchart object correct and I would use the Call renderChart function instead? also if I don't use the FC object can I still renderChart() and have the result be javascript?
-
Hi,
If you are able to render the charts then, what is your exact issue?
My problem is that it won't display and I can't find the error, I think it is in the render chart part . I have been able to render different charts with the same connection file so that isn't it. I thought I had pretty much the same format for this chart as the examples.
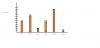
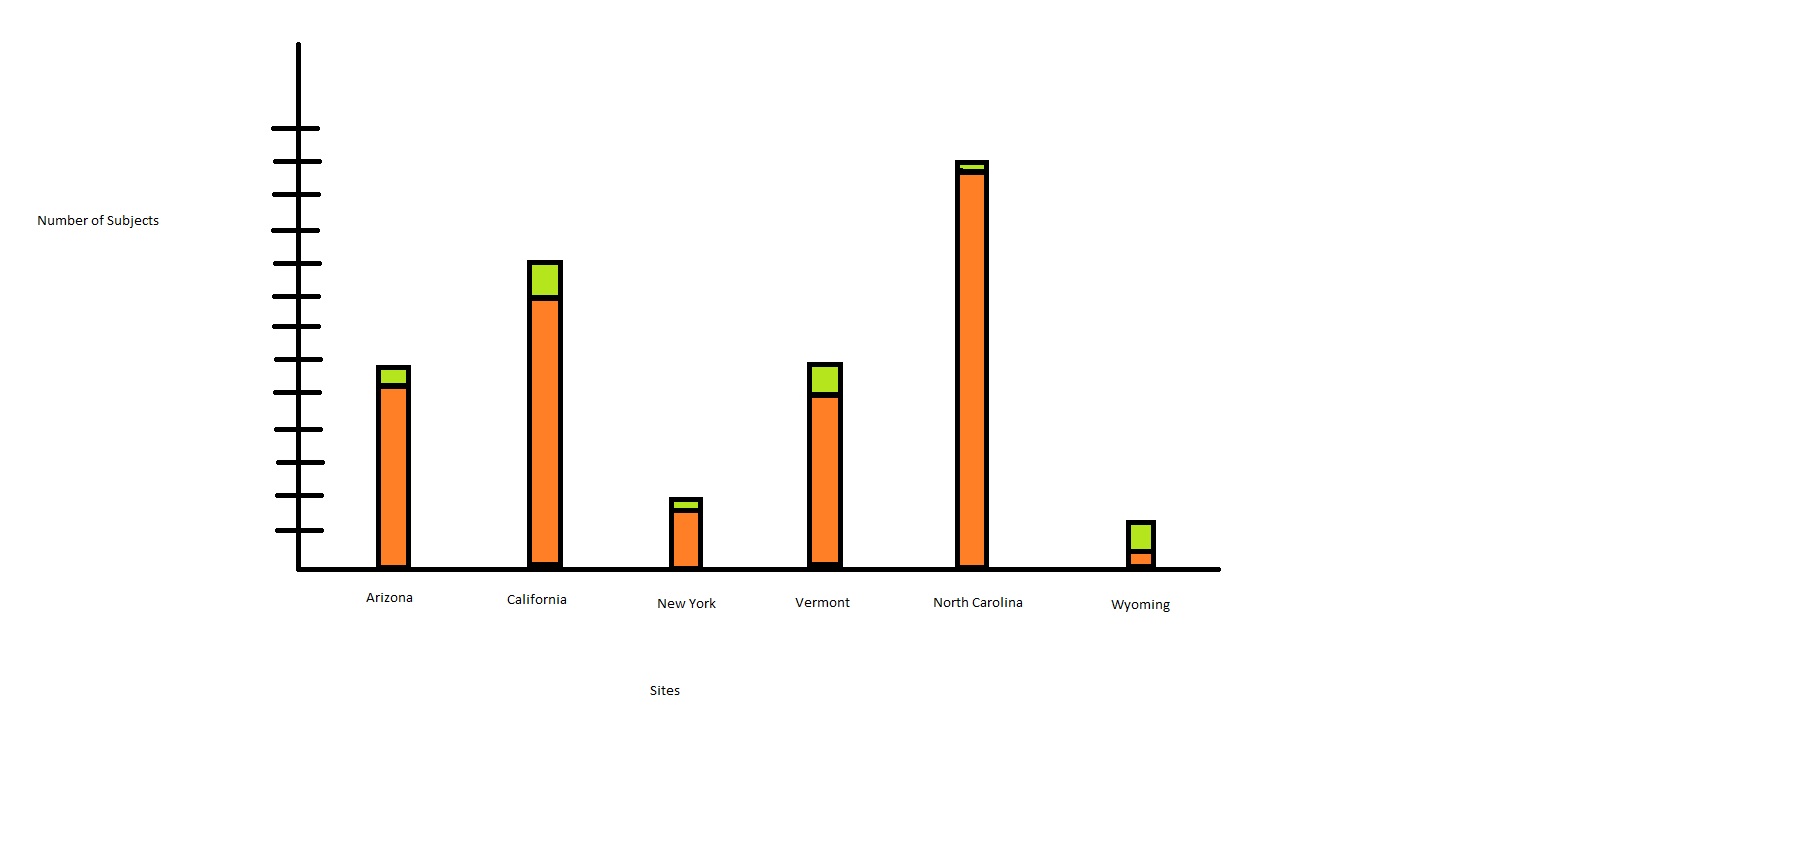
My goal is trying to display all/some of the sites with two different values for each site . They each need to be their own data set and I only have one category for the x axis because I just need the sites to show with two subdata sets stacked. Attached is an example of what I would like, and I think I have the set up correct for the most part....
-
Hi,
Please check your database connection.
You would need to configure the database connection according to your machine.
You can refer this link: http://www.connectionstrings.com/ for setting up the database.
Also, you can get the sample demo in the Download Package > Code > ASP > DBExample
Hope this helps.
I have already connected to the database and created several charts from the same database. I am using the same DBConn file as the other charts so I do not think that the connection is the problem. Do you have any other suggestions?
-
Hey,
Please refer to the following links:
http://docs.fusionch...ackedChart.html
http://docs.fusionch...icExamples.html
http://docs.fusionch...SPClass_DB.html
Hope this helps.
This is what I have been using to write it and try to fix it.
-
Hi,
Did you get the chart XML?
If not, then try using static XML data first and let us know.
No I haven't been able to get the chart xml. I changed methods and started using the set FC = new FusionCharts(I think asp class) because I was unable to create the xml and have the chart render using javascript. If you can elaborate on where to find the current xml then that would be great!
Or if you have any other advice Id appreciate it 
-
the chart type is supposed to be:
Call FC.setChartType("MSStackedColumn2D")
-
I ran into another problem and can't figure out a fix... This is my code
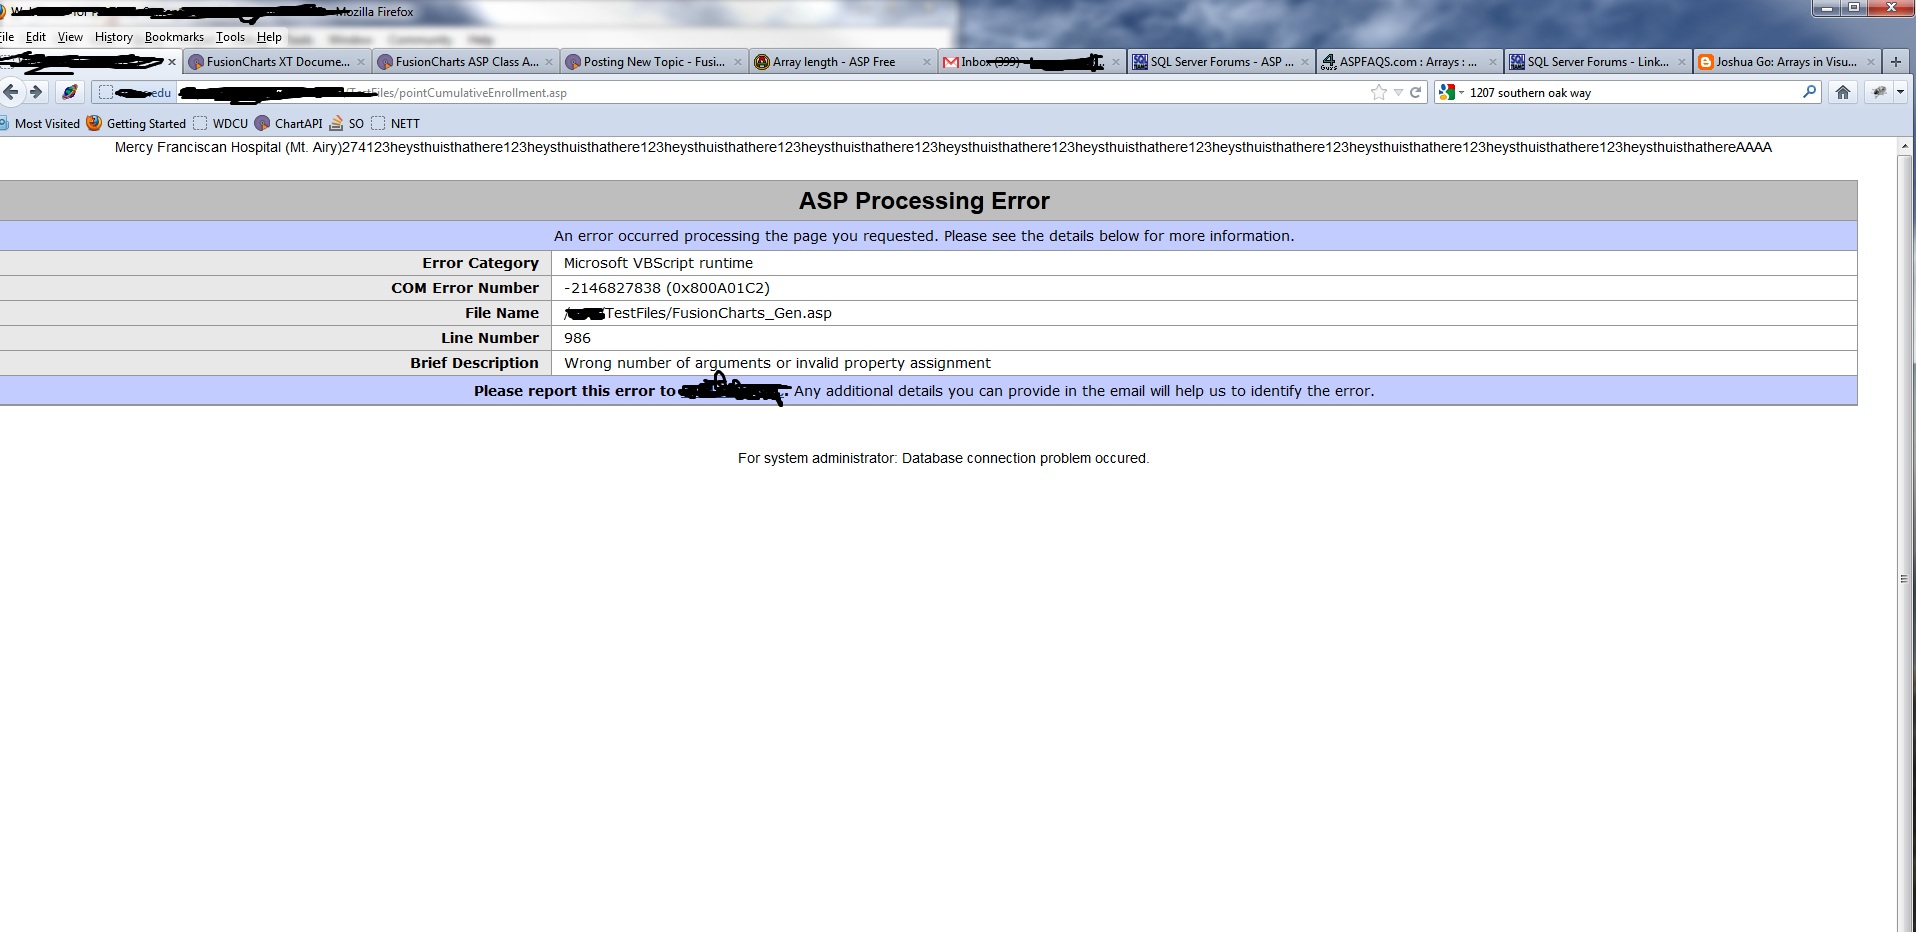
<%@ Language=VBScript %> <!-- #INCLUDE FILE="FusionCharts.asp" --> <!-- #INCLUDE File="NewArray.asp" --> <!-- #INCLUDE File="DBConn2.asp" --> <!-- #INCLUDE File="RaceandColor.asp" --> <!-- #INCLUDE File="FC_Colors.asp" --> <!--#include file="FusionCharts_Gen.asp"--> <!-- #include virtual="nett/header.asp" --> <html> <head> <meta http-equiv="Content-Type" content="text/html; charset=utf-8" /> <title></title> <link href="../assets/ui/css/style.css" rel="stylesheet" type="text/css" /> <script type="text/javascript" src="jquery.min.js"></script> <style type="text/css"> body,html,head,div{height:100%; min-height:100%;width:100%; } </style> <script LANGUAGE="Javascript" SRC="FusionCharts.js"></SCRIPT> </head> <body > <div class="gen-chart-render" > <% Dim strParams, strQuery,today,minID, maxID, totalID, TableValues,siteID, siteName, currentDate, startOfStudy,midDate,results dim count, numSites set FC = new FusionCharts Call FC.setChartType("StackedColumn3D")'change to multiseries Ychart Call FC.setSize("90%","90%") call FC.setSWFPath("../testfiles/") Call FC.setID("SiteEnrollment") Set oConn = Server.CreateObject("ADODB.Connection") Set oRs = Server.CreateObject("ADODB.Recordset") oConn.Open strConnQuery today=Date() cateCount=0 count = 1 startOfStudy = "2000-01-01" currentDate=Date() midDate=DateAdd("m",-1,currentDate) call FC.addCategory("","","") strQuery = "Select zSiteID, zSiteNm from vSite" set ors = oConn.Execute(strQuery) TableValues=oRs.getRows() strQuery = "Select count(*) as total from vSite" set ors = oConn.Execute(strQuery) numSites = oRs("total") response.write(TableValues(1,10)) response.Write(numSites) for x=0 to ubound(TableValues) siteID=TableValues(0,x) siteName=TableValues(1,x) strQuery="Select count(zsiteID) as number FROM vSubject Where zSiteID = "&siteID&" AND SubjectStartDate between '"&midDate&"' AND '"¤tDate&"' " set oRs=oConn.Execute(strQuery) response.Write("123") 'results = oRs.getRows() response.Write("heys") 'count = ubound(results) + 1 response.Write("thuis") count = oRs("number") Call FC.createMSStDataset() Call FC.addMSStSubDataset("","") Call FC.addChartData(""&count&"","","") response.Write("that") strQuery="Select count(zsiteID) as number FROM vSubject Where zSiteID = "&siteID&" AND SubjectStartDate between '"&startOfStudy&"' AND '"&midDate&"' " set oRs=oConn.Execute(strQuery) 'results = oRs.getRows() 'count = ubound(results) + 1 count = oRs("number") Call FC.addMSStSubDataset(""&siteName&"","") Call FC.addChartData(""&count&"","","") response.Write("here") x=x+1 next strParam="caption=Annual Revenue" call FC.setChartParams(strparam) call FC.SetRenderer( "javascript" ) response.Write("AAAA") call FC.renderChart(false) response.Write("AAAA") %> </body> </html>As you can see I have some response.writes in the code. I've figured out that is has to do with the FC.renderchart function. This is the error that i get(attached)Any advice or help would be great!


-
Hi,
For custom tool-tip you would need to add toolText attribute in the set element.
You would need to add following line code into your project to have custom tool-tip on the data-plots.
Ref. code:
Fc.addChartData("32","label=Week 1","toolText=myTooltext")
Great thanks so much!!!!
-
Hi, I have been able to create/render my chart fine. My only problem is that I can't figure out a way to add hover text to the points that aren't already labeled on the x axis. I was able to do this before with xml but I am trying the asp Class format now. Here is my code:
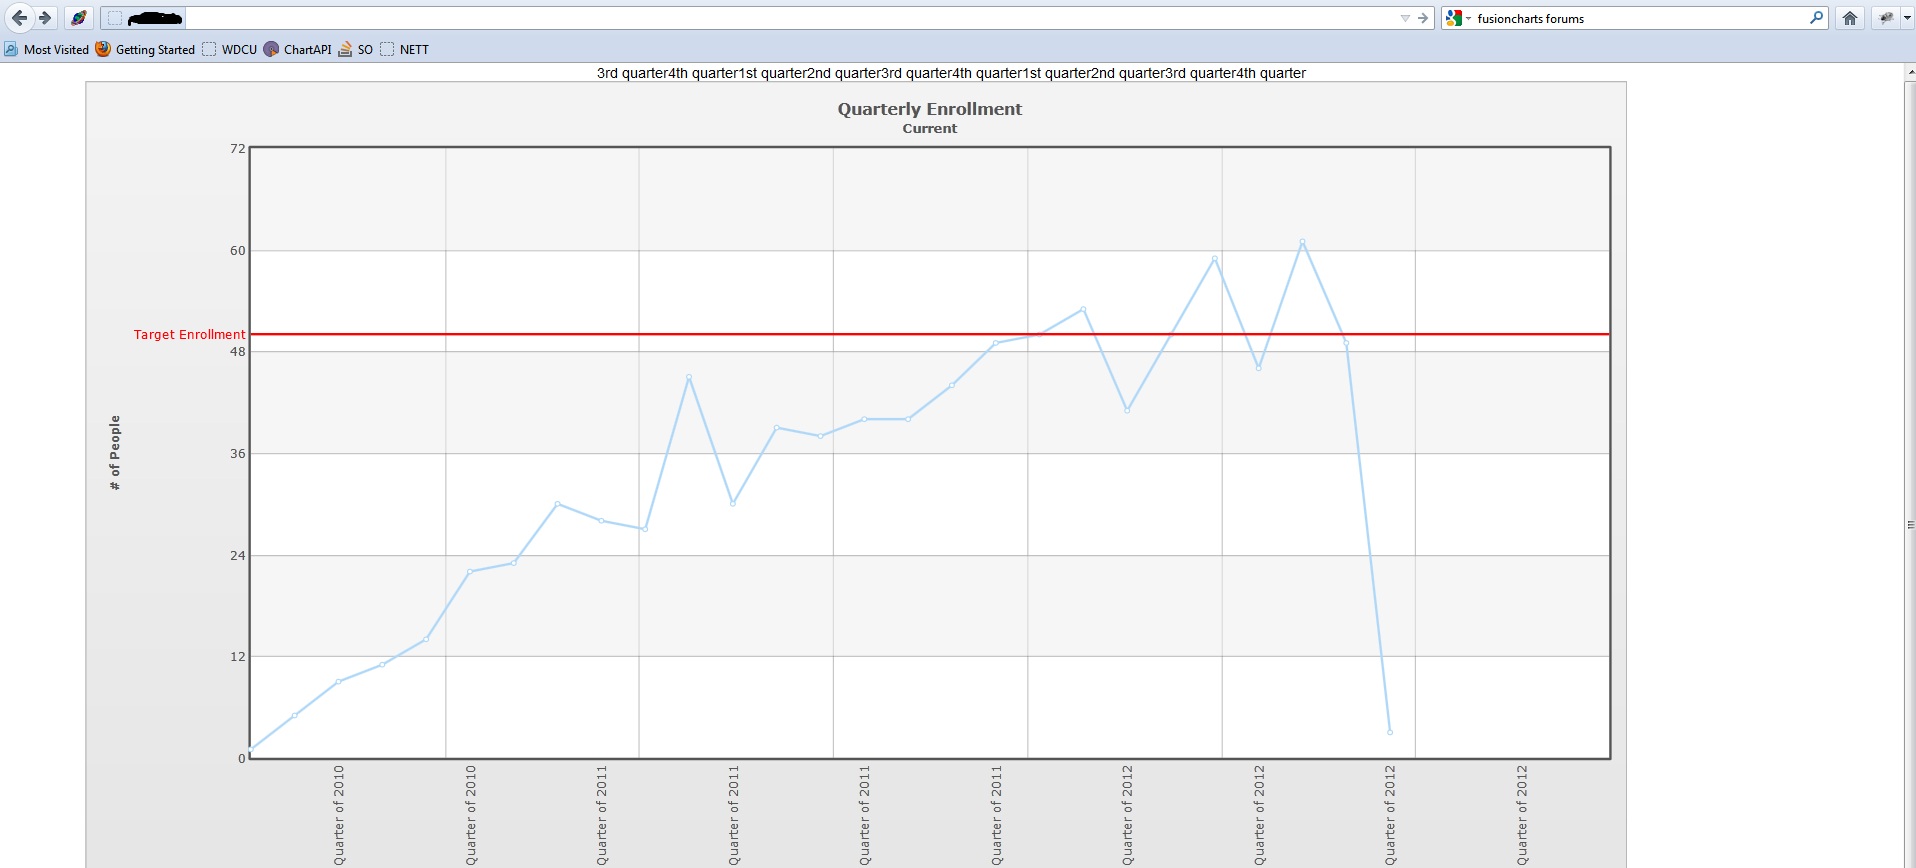
<!DOCTYPE html PUBLIC "-//W3C//DTD XHTML 1.0 Transitional//EN" "http://www.w3.org/TR/xhtml1/DTD/xhtml1-transitional.dtd">
<%@ Language=VBScript %>


<html>
<head>


   	<meta http-equiv="Content-Type" content="text/html; charset=utf-8" />

   	<title></title>
   	<link href="../assets/ui/css/style.css" rel="stylesheet" type="text/css" />
   	<script type="text/javascript" src="jquery.min.js"></script>

    	<style type="text/css">

       	body,html,head,div{height:100%; min-height:100%;width:100%; }
   	</style>
	<script LANGUAGE="Javascript" SRC="FusionCharts.js"></SCRIPT>
</head>
<!-- #INCLUDE FILE="FusionCharts.asp" -->
  <!-- #INCLUDE File="NewArray.asp" -->
  <!-- #INCLUDE File="DBConn2.asp" -->
  <!-- #INCLUDE File="RaceandColor.asp" -->
  <!-- #INCLUDE File="FC_Colors.asp" -->
  <!--#include file="FusionCharts_Gen.asp"-->
  <!-- #include virtual="nett/header.asp" -->

<body >

               	<div class="gen-chart-render"  >
<%
 Dim strValue,strCategory, count, lc, hWeek,lWeek,month,year,cateCount,today, diffDate,sum,syear,ors2,monthsA(6), monthsB(3),x, isInA,isInB
	dim FC
	monthsA(0)=1
	monthsA(1)=3
	monthsA(2)=5
	monthsA(3)=7
	monthsA(4)=8
	monthsA(5)=10
	monthsA(6)=12
	monthsB(0)=4
	monthsB(1)=6
	monthsB(2)=9
	monthsB(3)=11

set FC = new FusionCharts
Call FC.setChartType("Line")
Call FC.setSize("90%","90%")
call FC.setSWFPath("../testfiles/")
Call FC.setID("NewChart")
lc=0
Set oConn = Server.CreateObject("ADODB.Connection")
Set oRs = Server.CreateObject("ADODB.Recordset")
Set oRs2 = Server.CreateObject("ADODB.Recordset")
oConn.Open strConnQuery
today=Date()

  year=2010
  hWeek=31
  lWeek=01
  month=05
  syear=2011
  cateCount=0
  count = 1
  endDate=month&"/"&hWeek&"/"&year
do While DateDiff("d",CDate(endDate),today)>7
	do While month<=12 And DateDiff("d",CDate(endDate),today)>40
	diffDate = DateDiff("d",CDate(endDate),today)
   	x=0
   	isInA=false
   	isInB=false
   	do while x <= 6 and isInA = false

       	if monthsA(x) = month then
           	isInA = true
           	'response.Write(monthsA(x))
   	'response.Write("/br")
       	end if
       	x=x+1
   	loop
   	x=0
   	do while x <= 3 and isInB = false
       	if monthsB(x)=month then
           	'response.Write("arrayB")
           	isInB = true
          	' response.Write(monthsB(x))
       	end if
       	x=x+1
   	loop
   	'Starting new method for linegraph
       	sum = 0
		if isInA then
           	hWeek=31
           	'response.Write("work")
           	strQuery = "select sum(zStratumID) as TotOutput from zRandomizationCode where zRandomizedOn BETWEEN '"&year&"-"&month&"-"&lweek&"' AND '"&year&"-"&month&"-"&hweek&"' "
           	Set oRs = oConn.Execute(strQuery)
           	sum = oRs("TotOutput")
           	If month =1 then
           	response.write("1st quarter")
               	Call FC.addChartData("" & sum & "","label = 1st Quarter of "&year&"","")
           	Elseif month =10 then
           	response.write("4th quarter")
               	Call FC.addChartData("" & sum & "","label = 4th Quarter of "&year&"","")
           	elseif month = 7 then
           	response.write("3rd quarter")
               	Call FC.addChartData("" & sum & "","label = 3rd Quarter of "&year&"","")
           	Else
               	Call FC.AddchartData(""∑&"","","")
           	End if
        	end if
       	If isInB then
      	' response.Write("nope")
           	hWeek=30
           	strQuery = "select sum(zStratumID) as TotOutput from zRandomizationCode where zRandomizedOn BETWEEN '"&year&"-"&month&"-"&lweek&"' AND '"&year&"-"&month&"-"&hweek&"' "
           	Set oRs = oConn.Execute(strQuery)
           	sum = oRs("TotOutput")
           	if month = 4 then
           	response.write("2nd quarter")
               	Call FC.addChartData("" & sum & "","label = 2nd Quarter of "&year&";hoverText=qwe;","")
           	else
               	Call FC.addChartData("" & sum & "","HoverText=qwe","")
           	end if
       	end if
       	if isInA = false and isInB=false then 'for leapyear can use % of year
           	hWeek=28
           	strQuery = "select sum(zStratumID) as TotOutput from zRandomizationCode where zRandomizedOn BETWEEN '"&year&"-"&month&"-"&lweek&"' AND '"&year&"-"&month&"-"&hweek&"' "
           	Set oRs = oConn.Execute(strQuery)
           	sum = oRs("TotOutput")
           	Call FC.addChartData("" & sum & "","","")
       	end if
       	month = month + 1
     	loop
     	month = 1
     	year=year+1
      	endDate=month&"/"&hWeek&"/"&year
Loop
strparam=" caption=Quarterly Enrollment; subcaption=Current; xAxisName=Months; yAxisName=# of People; hovercapbg=FFECAA; hovercapborder=F47E00; formatNumberScale='0'; decimalPrecision='0'; showvalues=0; numdivlines=5; numVdivlines=6; yaxisminvalue='0'; lineThickness=2; rotateNames='1'; baseFontSize='15'; animation=0; shadow =0; alpha=0; anchorAlpha='0';showshadow=0; anchorRadius = 2;hoverText=1;"
	call FC.setChartParams(strparam)
	Call FC.addTrendLine("startValue=50;endValue=50;color=FF0000;displayvalue=Target Enrollment;thickness=2;alpha=100;isTrendZone=0;showOnTop=1")
 call FC.SetRenderer( "javascript" )
 call FC.renderChart(false)

  Set oRs = Nothing
  oConn.close
    	%>

               	</div>

</body>
</html>
and here is a picture of my chart.
-
Hello,
So I've been able to connect to the Access DB but now I'm trying to connect to our test server. I am almost positive that I have permission to connect to this server but I am not server savvy.... This is my BasicDBSampleSales.asp file and after that is my DBConn1.asp file.
I have removed the servername, username, and password for personal reasons.....
<%
Dim oConn
if not isObject(oConn) then
	'Dim strConnQuery
	Set oConn = Server.CreateObject("ADODB.Connection")
	oConn.Open"Driver={SQL Server}; Server=______; Uid=____; Pwd=______; Database=Sales;"
end if
%>
Here is the error I get when I try to run it through ISS
Microsoft OLE DB Provider for ODBC Drivers error '80004005'
[Microsoft][ODBC SQL Server Driver][DBNETLIB]SQL Server does not exist or access denied.
/FusionChart/Evaluation/DBConn1.asp, line 6
If anyone sees anything obvious that I have brushed by please let me know.
I had a lot of bs problems with connecting to mssql server so my only guess would be to try to change the driver and maybe remove the semicolon after sales?
Driver={SQL Server Native Client 10.0};Server=___;UID=_____;PWD=___;DATABASE=Sales
That is the only thing different in my code and yours. Also I have:
oConn.Mode =3
I don't know if that makes any difference but good luck!
-
Hi,
With regard to your query, it seems from your code that you are using FusionCharts Free and trying to render the chart in JavaScript mode.
Please note that FusionCharts free is a open source Flash charting component which originally was FusionCharts V2.3 and does not support JavaScript Charts.
However you can download the latest Evaluation version of FusionCharts XT and test your code.
Let me clarify that there is no feature limitation in the Evaluation version of FusionCharts XT, except for the fact that the evaluation version charts are watermarked.
Hope this helps!
I have the evaluation version and this was code from the free version. But I changed some of the code and can get it to work with the evaluation version, I just can't get it to render in javascript. It comes up as a flash object just fine but not javascript(stays "loading")
-
can't upload text and htm was hard to read so here it all is.... sorry

Also if I can get this working then my boss wants to buy it, Please help cause I don't want to figure out another method of creating such nice charts

<!DOCTYPE html PUBLIC "-//W3C//DTD XHTML 1.0 Transitional//EN" "http://www.w3.org/TR/xhtml1/DTD/xhtml1-transitional.dtd">
<%@ Language=VBScript %>


<html>
<head>


   	<meta http-equiv="Content-Type" content="text/html; charset=utf-8" />

   	<title>FusionCharts - Database Example</title>
   	<link href="../assets/ui/css/style.css" rel="stylesheet" type="text/css" />
   	<script type="text/javascript" src="jquery.min.js"></script>
   	<script type="text/javascript" src="lib.js"></script>
    	<style type="text/css">
       	h2.headline {
           	font: normal 110%/137.5% "Trebuchet MS", Arial, Helvetica, sans-serif;
           	padding: 0;
           	margin: 25px 0 25px 0;
           	color: #7d7c8b;
           	text-align: center;
       	}
       	p.small {
           	font: normal 68.75%/150% Verdana, Geneva, sans-serif;
           	color: #919191;
           	padding: 0;
           	margin: 0 auto;
           	width: 664px;
           	text-align: center;
       	}
       	body,html,head,div{height:100%; min-height:100%;width:100%; }
   	</style>
	<script LANGUAGE="Javascript" SRC="FusionCharts.js"></SCRIPT>
</head>
<!-- #INCLUDE FILE="FusionCharts.asp" -->
  <!-- #INCLUDE File="NewArray.asp" -->
  <!-- #INCLUDE File="DBConn2.asp" -->
  <!-- #INCLUDE File="RaceandColor.asp" -->
  <!-- #INCLUDE File="FC_Colors.asp" -->
  <!--#include file="FusionCharts_Gen.asp"-->
<!-- some of the strings are in there cause I changed how I was loading the information so just ignore those please -->

<body >

               	<div class="gen-chart-render"  >
<%
 Dim strValue,strCategory, count,hWeek,lWeek,month,year,cateCount,today, diffDate
	dim FC
  ' Create FusionCharts ASP class object
set FC = new FusionCharts
  ' Set chart type to Multiseries Column3D chart
Call FC.setChartType("MSLine")
  ' Set chart size
Call FC.setSize("90%","90%")
  ' Set the relative path of the SWF file
call FC.setSWFPath("../Evaluation/")
Call FC.setID("NewChart")

  year=2010
  hWeek=8
  lWeek=1
  month=04
  cateCount=0
  Set oConn = Server.CreateObject("ADODB.Connection")
  count = 1
  Set oRs = Server.CreateObject("ADODB.Recordset")
  oConn.Open strConnQuery

  today=Date()
  strValue="<dataset seriesname='Current' color='0099CC' showValue='1' alpha='100' linethickness='4'>"


  strCategory="<categories>"
 endDate=month&"/"&hWeek&"/"&year
Do While DateDiff("d",CDate(endDate),today)>1
	Do While month<=12 And DateDiff("d",CDate(endDate),today)>1
	diffDate = DateDiff("d",CDate(endDate),today)
		Do While diffDate>1 and hWeek<=31
		cateCount=cateCount+1
		strQuery= "Select Top 1Max(zCumuEnrolled) AS TotOutput, DateName(mm,zDate) as Date1, DatePart(yyyy,zDate) as Date2 From point.dbo.vRecrruitment where zDate BETWEEN '"&year&"-"&month&"-"&lWeek&"' AND '"&year&"-"&month&"-"&hWeek&"' group by  zDate, zCumuEnrolled ORDER BY zCumuEnrolled DESC "
		Set oRs = oConn.Execute(strQuery)
		strValue= strValue & "<set value='" & oRs("TotOutput") & "' />"
		if count=1 Then
				 Call FC.addCategory(""&count&"st week of "&oRs("Date1")&" "&oRs("Date2")&"","","")
				hWeek=hWeek+8
			End if
		If  count = 2 then
				Call FC.addCategory("","","")
				hWeek=hWeek+8
				End if
		If count = 3 then
				Call FC.addCategory(""&count&"rd week of "&oRs("Date1")&" "&oRs("Date2")&"","","")
			If month=2 Then
				hWeek=hWeek+4
			ElseIf month=4 Then
				hWeek=hWeek+6
			elseIf month=6 then
				hWeek=hWeek+6
			elseIf month=9 then
				hWeek=hWeek+6
			elseIf month=11 then
				hWeek=hWeek+6
			Else
				hWeek=hWeek+7
			End if
			End If

		If count = 4 Then
			Call FC.addCategory("","","")
           	'hoverText='"&count&"th week of "&oRs("Date1")&" "&oRs("Date2")&"'/>"
			hWeek=hWeek+8
			End If
		endDate=month&"/"&lWeek&"/"&year'could be causing trouble
		count=count+1
		lWeek=lWeek+8
		diffDate = DateDiff("d",CDate(endDate),today)
		Loop
		hWeek=8
		lWeek=1
		month=month+1
		count = 1
		endDate=month&"/"&lWeek&"/"&year
	Loop
	month=1
	year=year+1
	endDate=month&"/"&hWeek&"/"&year
Loop

  strCategory = strCategory & "</categories>"
  'START OF CURRENT
year=2010
  hWeek=8
  lWeek=1
  month=04

  Call FC.AddDataset("Current","")
  endDate=month&"/"&hWeek&"/"&year
Do While DateDiff("d",CDate(endDate),today)>1
	Do While month<=12 And DateDiff("d",CDate(endDate),today)>1
	diffDate = DateDiff("d",CDate(endDate),today)
		Do While diffDate>1 and hWeek<=31
		cateCount=cateCount+1
		strQuery= "Select Top 1Max(zCumuEnrolled) AS TotOutput, DateName(mm,zDate) as Date1, DatePart(yyyy,zDate) as Date2 From point.dbo.vRecrruitment where zDate BETWEEN '"&year&"-"&month&"-"&lWeek&"' AND '"&year&"-"&month&"-"&hWeek&"' group by  zDate, zCumuEnrolled ORDER BY zCumuEnrolled DESC "
		Set oRs = oConn.Execute(strQuery)
		Call FC.addChartData("" & oRs("TotOutput") & "","","")
		if count=1 Then
				hWeek=hWeek+8
				End if
		If  count = 2 then
				hWeek=hWeek+8
				End if
		If count = 3 then
			If month=2 Then
			hWeek=hWeek+4
			ElseIf month=4 Then
			hWeek=hWeek+6
			elseIf month=6 then
			hWeek=hWeek+6
			elseIf month=9 then
			hWeek=hWeek+6
			elseIf month=11 then
			hWeek=hWeek+6
			Else
			hWeek=hWeek+7
			End if
		End If
		If count = 4 Then
			hWeek=hWeek+8
			End If

		count=count+1
		lWeek=lWeek+8
		Loop
		hWeek=8
		lWeek=1
		month=month+1
		count = 1
		 endDate=month&"/"&lWeek&"/"&year
	Loop
	month=1
	year=year+1
	 endDate=month&"/"&lWeek&"/"&year
Loop
 endDate=month&"/"&hWeek&"/"&year


  'START OF TARGET!!!!
  year=2010
  hWeek=8
  lWeek=1
  month=04
endDate=month&"/"&hWeek&"/"&year
  Call FC.AddDataset("Target","")
  	Do While DateDiff("d",CDate(endDate),today)>1
	Do While month<=12 And DateDiff("d",CDate(endDate),today)>1
	diffDate = DateDiff("d",CDate(endDate),today)
		Do While diffDate>1 and hWeek<=31
		strQuery= "Select Top 1Max(zTarget) AS TotOutput, DateName(mm,zDate) as Date1, DatePart(yyyy,zDate) as Date2 From point.dbo.vRecrruitment where zDate BETWEEN '"&year&"-"&month&"-"&lWeek&"' AND '"&year&"-"&month&"-"&hWeek&"' group by  zDate, zTarget ORDER BY zTarget DESC "
		Set oRs = oConn.Execute(strQuery)
		Call FC.addChartData("" & oRs("TotOutput") & "","","")
		if count=1 Then
				hWeek=hWeek+8
				End if
		If  count = 2 then
				hWeek=hWeek+8
				End if
		If count = 3 then
			If month=2 Then
			hWeek=hWeek+4
			ElseIf month=4 Then
			hWeek=hWeek+6
			elseIf month=6 then
			hWeek=hWeek+6
			elseIf month=9 then
			hWeek=hWeek+6
			elseIf month=11 then
			hWeek=hWeek+6
			Else
			hWeek=hWeek+7
			End if
		End If
		If count = 4 Then
			hWeek=hWeek+8
			End If

		count=count+1
		lWeek=lWeek+8
		Loop
		hWeek=8
		lWeek=1
		month=month+1
		count = 1
		 endDate=month&"/"&lWeek&"/"&year
	Loop
	month=1
	year=year+1
	 endDate=month&"/"&lWeek&"/"&year
Loop
 endDate=month&"/"&hWeek&"/"&year
cateCount=cateCount/2
strparam=" caption='Yearly Enrollment' subcaption='Current vs. Target ' xAxisName='Year' yAxisName='# of People' hovercapbg='FFECAA' hovercapborder='F47E00' formatNumberScale='0' decimalPrecision='0' showvalues='0' numdivlines='4' numVdivlines='"&cateCount&"' yaxisminvalue='0' lineThickness='5' rotateNames='1' bgcolor='F6F5E6' baseFontSize='15' animation='0' shadow ='0' alpha='0' anchorAlpha='0'showshadow='0'"
	call FC.setChartParams(strparam)

 call FC.SetRenderer( "javascript" )
 call FC.renderChart(false)
'var myChart = new FusionCharts("FCF_MSLine.swf", "chartdiv1","50%", "50%")
' myChart.setXML("strXML")
' myChart.render("chartdiv1")
  Set oRs = Nothing
  oConn.close
    	%>

               	</div>
               	<div class="clear"></div>
               	<p> </p>
               	<p class="small">Or, right click on any pie to enable slicing or rotation mode. </p>


       	<div id="footer">
           	<ul>
               	<li><a href="../index.html"><span>« Back to list of examples</span></a></li>
               	<li class="pipe">|</li>
               	<li><a href="../NoChart.html"><span>Unable to see the chart above?</span></a></li>
           	</ul>
       	</div>

</body>
</html>

Exporting
in FusionCharts and ASP
Posted · Report reply
I have another question. I had to change the rendering type from javascript to flash and now when I try to export/save I right click and select the format. It does its little loading animation then nothing happens. If I render it in javascript then the export works fine.. So my code is the exact same minus changing the SETRenderer(). Any ideas?