
CW
-
Content count
7 -
Joined
-
Last visited
Posts posted by CW
-
-
I've attached the xml and a jpg showing how the chart is rendering. I've got this working fine in Area2D charts, but for some reason it's ignoring it in this MSColumn2D chart. Any idea why?
-
Excellent, thanks. That did the trick.
-
I have 2 charts keeping track of aquarium temperature and pH over time. I'm using MSArea.swf for the chart. The normal pH range falls between around 7.8 and 8.5. However, the Y axis of this chart only displays 7, 8 and 9. It would be very useful if I could have it display a line for every 2/10s instead of only every integer. How do I accomplish this?
-
I'd love to see a reply from someone at FC on this as I'm experiencing a very similar problem, and I see no response or resolution in this forum.
-
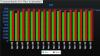
I've run into a limitation when using an array collection for charting. I'm using a StackedColumn3DLineDY chart and wanted to show 92 days worth of data for 7 groups of data (7 groups x 92 days). However, the chart displays nothing when I did this. A co-worker worked on it and found that if we reduce the array collection to 14 days (times 7 groups) the chart displayed fine. But going up to 15 days it would display nothing at all. Is there a limitation to this chart when using an array collection to define the data? I've tried the same chart using xml to define 92 days of data and it worked fine. I'm curious why the array collection isn't working, as it is our preferred way of handling the data.
Here's a screenshot of the chart I'm describing showing the working xml version:

I've played with the array collection version myself and have run into a similar limit. My array collection that I'm using will display the chart if the total items in the collection does not exceed 138. Once I add a 139th item, the chart will not load. Here is the array collection I'm using:
[bindable]
private var cData:ArrayCollection=new ArrayCollection([
{label:'1'},
{label:'2'},
{label:'3'},
{label:'4'},
{label:'5'},
{label:'6'},
{label:'7'},
{label:'8'},
{label:'9'},
{label:'10'},
{label:'11'},
{label:'12'},
{label:'13'},
{label:'14'},
{label:'15'},
{label:'16'},
{label:'17'},
{label:'18'},
{seriesName:'Aggregator', parentYAxis:'P', color:'36a2a2'},
{value:'1449'},
{value:'1327'},
{value:'1489'},
{value:'1267'},
{value:'1715'},
{value:'1881'},
{value:'1786'},
{value:'1715'},
{value:'540'},
{value:'1235'},
{value:'1383'},
{value:'1204'},
{value:'1100'},
{value:'1288'},
{value:'590'},
{value:'1893'},
{value:'1184'},
{seriesName:'Channel Sales', parentYAxis:'P', color:'a81d22'},
{value:'143'},
{value:'218'},
{value:'194'},
{value:'914'},
{value:'383'},
{value:'299'},
{value:'623'},
{value:'236'},
{value:'1050'},
{value:'628'},
{value:'465'},
{value:'707'},
{value:'647'},
{value:'944'},
{value:'908'},
{value:'687'},
{value:'218'},
{seriesName:'DR Media', parentYAxis:'P', color:'bbd84a'},
{value:'459'},
{value:'376'},
{value:'307'},
{value:'876'},
{value:'886'},
{value:'667'},
{value:'802'},
{value:'822'},
{value:'565'},
{value:'616'},
{value:'668'},
{value:'743'},
{value:'771'},
{value:'753'},
{value:'760'},
{value:'456'},
{value:'438'},
{seriesName:'Paid Search', parentYAxis:'P', color:'52256d'},
{value:'1943'},
{value:'1284'},
{value:'1604'},
{value:'1773'},
{value:'1212'},
{value:'1814'},
{value:'1514'},
{value:'1754'},
{value:'2377'},
{value:'1790'},
{value:'891'},
{value:'938'},
{value:'2258'},
{value:'1075'},
{value:'2063'},
{seriesName:'Referral', parentYAxis:'P', color:'faeb50'},
{value:'1342'},
{value:'1190'},
{value:'1081'},
{value:'1092'},
{value:'1288'},
{value:'1225'},
{value:'1208'},
{value:'1074'},
{value:'1294'},
{value:'1121'},
{value:'1222'},
{value:'1380'},
{value:'1320'},
{value:'1215'},
{value:'1250'},
{seriesName:'Source Indeterminate', parentYAxis:'P', color:'186baf'},
{value:'2932'},
{value:'2496'},
{value:'2288'},
{value:'2158'},
{value:'2548'},
{value:'3013'},
{value:'2913'},
{value:'1969'},
{value:'1864'},
{value:'2792'},
{value:'1808'},
{value:'2664'},
{value:'2570'},
{value:'2519'},
{value:'1955'},
{seriesName:'Targeted Spend', parentYAxis:'P', color:'cf4f28'},
{value:'1534'},
{value:'1052'},
{value:'1527'},
{value:'903'},
{value:'1576'},
{value:'1499'},
{value:'1546'},
{value:'1365'},
{value:'785'},
{value:'1202'},
{value:'1545'},
{value:'1312'},
{value:'830'},
{value:'1363'},
{value:'948'},
{seriesName:'Application Rates', parentYAxis:'S', color:'000000'},
{value:'4.666'},
{value:'8.333'},
{value:'7.265'},
{value:'1.378'},
{value:'1.033'},
{value:'1.732'},
{value:'2.971'},
{value:'8.365'},
{value:'9.131'},
{value:'8.083'},
{value:'8.276'},
{value:'7.168'},
{value:'4.289'},
{value:'4.676'},
{value:'7.346'},
]);
I've also setup error handling like so:
private function init():void
{
// FC1.FCData(cData);
// FC1.FCParams(cParams);
// FC1.FCRender();
FC1.addEventListener("FCErrorEvent", errorHandler);
}
private function errorHandler(e:FCEvent):void
{
Alert.show(e.param);
}
But no alert fires when the chart fails to load, I just get an empty white screen.
-
I need to create a stacked column chart with a trendline over it, however the trend line will not be a straight line. It needs to have datapoints in each column. Is this possible? Here is an example image of what I need to display:

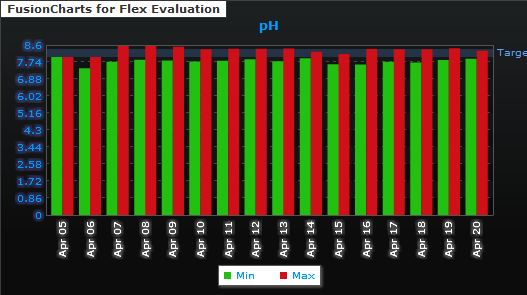
YAxisMinValue and YAxisMaxValue not working for MSColumn2D
in Installation and Upgrades
Posted · Report reply
Awesome, thanks for catching that Santa.