
jayant_it
-
Content count
2 -
Joined
-
Last visited
Posts posted by jayant_it
-
-
Hi,
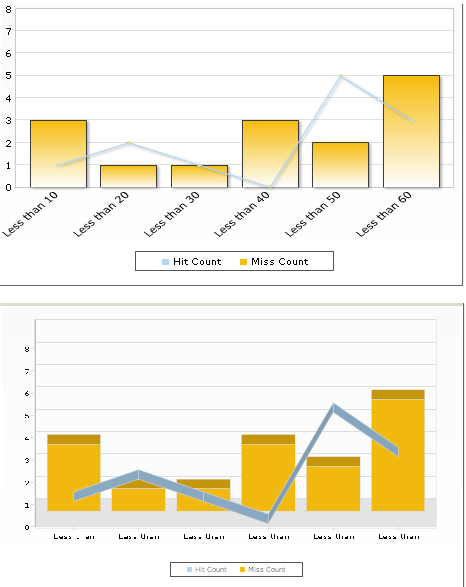
I am trying to use MSCombi3D. However facing multiple issues with labels.
However MSCombi2D works really well and doesnt have any problem with the same chart xml.
Please see picture below of MSCombi2D (without issue) and MSCombi3D with issue.
1. Data Labels getting truncated
2. Chart not responding to label parameters (labelDisplay='ROTATE' slantLabels='1')
3. Yaxis label unclear
Here is the Chart XML used for both.
<chart lineThickness='0.5' shadowAlpha='0' showShadow='1' showFCMenuItem='0' showValues='0' anchorRadius='1.5' divLineAlpha='100' divLineColor='E0E0E0' divLineIsDashed='0' showAlternateHGridColor='0' alternateHGridAlpha='3' alternateHGridColor='000000' adjustDiv='1' numDivLines='7' numVDivLines='5' vDivLineIsDashed='0' vdivLineAlpha='100' vdivLineColor='E0E0E0' showAlternateVGridColor='0' numberScaleValue='1000,1000,1000' numberScaleUnit='K,M,B' formatNumber='1' formatNumberScale='1' chartRightMargin='5' chartLeftMargin='0' chartTopMargin='5' showBorder='0' bgColor='FFFFFF,CACACA' bgAngle='270' bgAlpha='10,10' setAdaptiveYMin='1' enableSmartLabels='1' labelDisplay='ROTATE' slantLabels='1' labelStep='1' connectNullData='1' baseFont ='Verdana' baseFontSize ='10' legendPosition='BOTTOM' showLegend='1' legendShadow='0' showCanvasBase='0' canvasBorderColor='000000' canvasBorderThickness='1' canvasBorderAlpha='20' outCnvbaseFontSize='10' outCnvBaseFontColor='000000' xAxisName='Amount' yAxisName='' captionPadding='2' xAxisNamePadding='0' yAxisNamePadding='0' startAngY='-30' XYWallDepth='2' endAngY='0' ZXWallDepth='2' ><categories><category label='Less than 10' /><category label='Less than 20' /><category label='Less than 30' /><category label='Less than 40' /><category label='Less than 50' /><category label='Less than 60' /></categories><dataset seriesName='Hit Count' anchorBgColor='FFFF00' renderAs='Line' ><set value='1' /><set value='2' /><set value='1' /><set value='0' /><set value='5' /><set value='3' /></dataset><dataset seriesName='Miss Count' anchorBgColor='FFFF00' renderAs='Column' ><set value='3' /><set value='1' /><set value='1' /><set value='3' /><set value='2' /><set value='5' /></dataset><styles> <definition> <style name='CaptionFont' type='font' size='0' /> <style name='myLegendFont' type='font' isHTML='1' /> </definition> <application> <apply toObject='CAPTION' styles='CaptionFont' /> <apply toObject='SUBCAPTION' styles='CaptionFont' /> <apply toObject='LEGEND' styles='myLegendFont' /> </application> </styles> </chart>
Please advice.
Venn diagrams in Fusioncharts v3
in General usage
Posted · Report reply
Hi,
We are also looking for Venn diagrams or something similar. Attached is the e.g. of what we are trying to represent.
Please advice.
Thanks
Jayant
Barclays Capital.
venn_diagram.bmp