
pgvdnagendra
-
Content count
27 -
Joined
-
Last visited
Posts posted by pgvdnagendra
-
-
Hi Basundhara,
I solved tht problem.
I got another one 4 u, while I am exporting the data to .Xls, .doc, sometimes
I am getting the previous charts displayed(evethough its capturing the new chart) in the .xls (or) .doc file.
Thanks
Nagendra
-
Hi Sanjukta,
How r u?
Thx for ur reply.
I tried to wrtie the caption as "Growth rate (%)".
But on th chart it display only "Growth rate ( ",
Is there any other way I can print % in the caption.
This is very important for me, please help me.
Bye.
Thanks
Nagendra
-
Hi Basundhara,
How r u doing?
I need to fix the length of the legend display in the chart.
Thanks
Nagendra
-
Hi Basundhara Ghosal,
I am doing well.
How r u doing?
The problem with using category is that the values of lables comes dynamically.
I dont know the exact scale values.
Thanks
Nagendra
-
Hi Sanjukta,
How r u doing?
How can I display lables on X-axis in scatter plot?
Thanks
Nagendra.
-
Hai Sanjukta,
It Works!

Is there a way I can control speed at which bars comes from flash.
Thanks
Nagendra
-
Hai
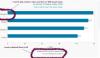
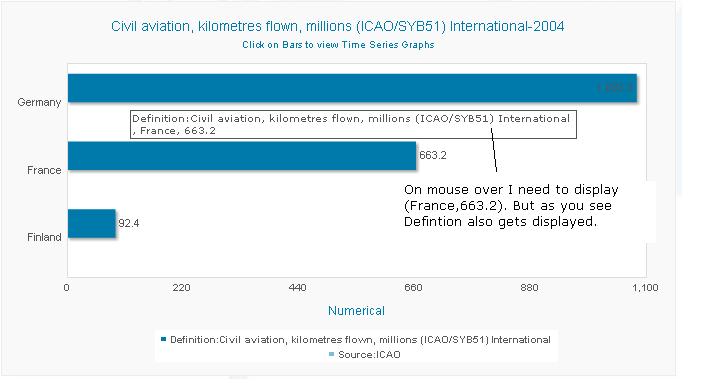
I need some help in changing format of text displayed on bar charts when hover on it.
Please see the attachment.
Thanks
Nagendra

-
Hai Sanjukta,
How r u?
Thanks for quick reply last time.
It worked for me.
I have other problem.
Please find the same in the attachment.
Waiting for your solution.:ermm:
Thank You.
Nagendra.
-
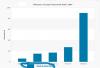
Hai Sanjukta,
The values on the bar graph are rounding off. But I need to put the exact values.
For example:- 10.6 is rounded to 10 while displaying on the bar.
Please help me on this.
Thanks
Nagendra
-
Hai Basundhara Ghosal,
I need to use drill downs for MSBar2D graphs I use the following
It Worked But when I try to use '&' in the link URL It is saying Invalid XML.
Please get back on this.
Thanks
Nagendra
-
Hai Basundhara Ghosal,
Thx for your quick response.
But I need to show a square box with color same as the bars have and some text beside it.
As I said I used tag in MSBar2D
It worked fine, I dont understand why its not working here.
I would also like to know where the saved JPEG,PDF will be stored.
Please get back on this thank you.
BYE
Nagendra
-
Hai Basundhara Ghosal,
Gd Mrng.
I am srry i forget to attach the image.
know u can find sample.jpg with this post.
Thank you.
-
Hai Basundhara Ghosal,
How are you?
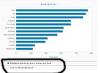
I want to add some description to the Column2D chart.
Like the one in the attachment.
I was able to add the description in MSBar2D charts.
I don't know why I was not able to do the same in Column2D charts.
Please help me.,
Thanks
Nagendra.
-
HI Basundhara Ghosal,
How r you?
My problem of write text on chart canvas still remains the same.
Can please find some other solution.
Thanks
Nagendra.
-
Hai Bhaduri,
Thanks for your information.
Its very useful to me.
see you.
Thanks
Nagendra
-
Hai Basundhar,
Thanks.
I hope it gets solved. Actually which city you people work from.
I also wanted to know the cost of fusion charts for one website.
Please help me in this.
Thanks
Nagendra
-
Hai Basundhara,
I know the values of x,y axis only at run-time. I think the xml you send to me is not quite useful.
Any way I will try to find some other solution.
Thank You
NAgendra
-
Hai Basundhara,
I am fine.
My life was so boring.
I am sending you the XML and html files for the scatter graph.
Plz go through them.
Thanks
Nagendra.
-
Hai Basundhara,
How are you?
Hmmmm thats so disappointing.
I got other isuue, while I am using scatter graph if the values of two scatter vales are same, they get overlapped. I am sending the sample graph.
Please go through the attachment.
Bye Bye.
Have a nice Weekend
Thanks
Nagendra.
-
Hai Basundhara,
That s Fine.
I am desperately waiting for your reply.
Thanks
Nagendra
-
Hai Basundhara,
I am doing well.
I am sending you the xml, html files please go through them and let me know the way out.
Waiting to hear from you.
Thank You
Nagendra
-
Hai Basundhara,
How r you.
Sorry to say you that "showBorder" tag not working .
I wrote showBorder='0' in chart attributes. But, its still not working.
Hope You will find me the way out from this issue.
Thank You
Nagendra
-
Hai Basundhara,
Any way thanks for trying.
I got another issue, I was trying to remove the borders for the ssgrid but its not working.
So please help me on this.
Thanks
Nagendra
-
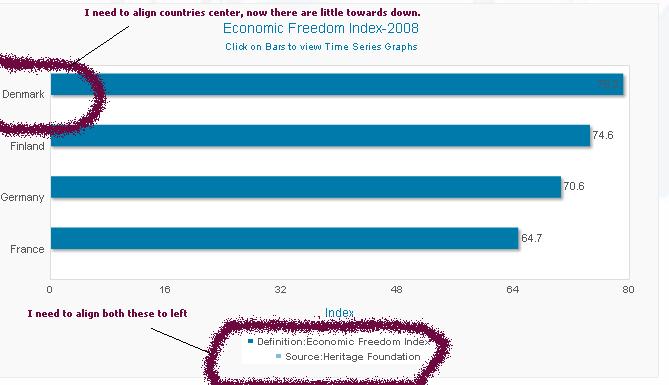
Hai Basundhara Ghosal,
Thanks for the reply. I already try that thing, but its showing the "source" line right below x-axis label. But I need to display it in left most position.
Any way thx for the reply:)

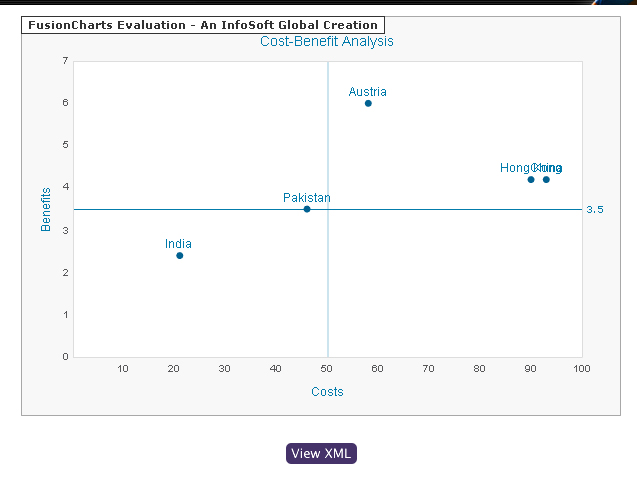

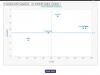
Scatter plot
in FusionCharts Free and ASP
Posted · Report reply
HI,
I hav a sample scatter plot.
Is it possible to create a same kind of chart with fusion charts.
Please go thru the attavhed file.
Thanks
Nagendra