
LeonWood
-
Content count
13 -
Joined
-
Last visited
Posts posted by LeonWood
-
-
if i have source code ,could i modify it and realize same value add on one tooltip?
Hi,
I am afraid, there is no such attribute in FusionCharts to show all tooltips for same value.
You would need to use different values in order to show tooltip for individual <set> element.
Hope this helps.

-
Hi,
Thanks for your post.
I am afraid, we are not able to uderstand your question properly. Could you pleaae elaborate your query a bit more?
Please try the same by setting <adjustDiv='0'> attribute inside the <chart> element.
FusionCharts automatically tries to adjust divisional lines and limit values based on the data provided. However, if you want to set your explicit lower and upper limit values and number of divisional lines, first set this attribute to false. That would disable automatic adjustment of divisional lines.
Hope this helps.
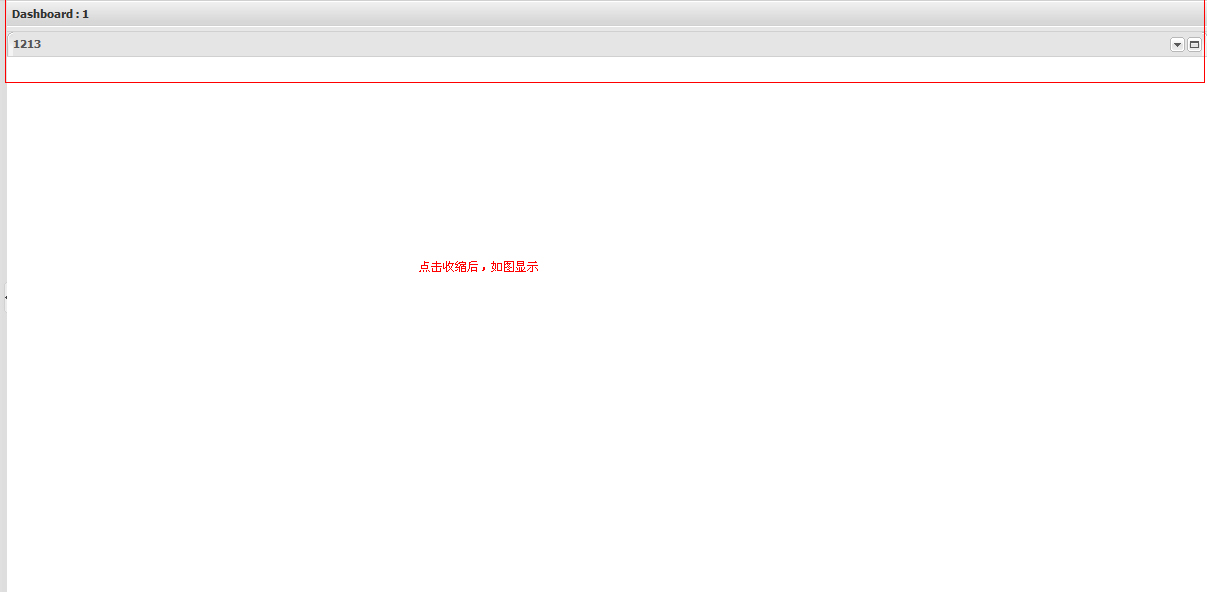
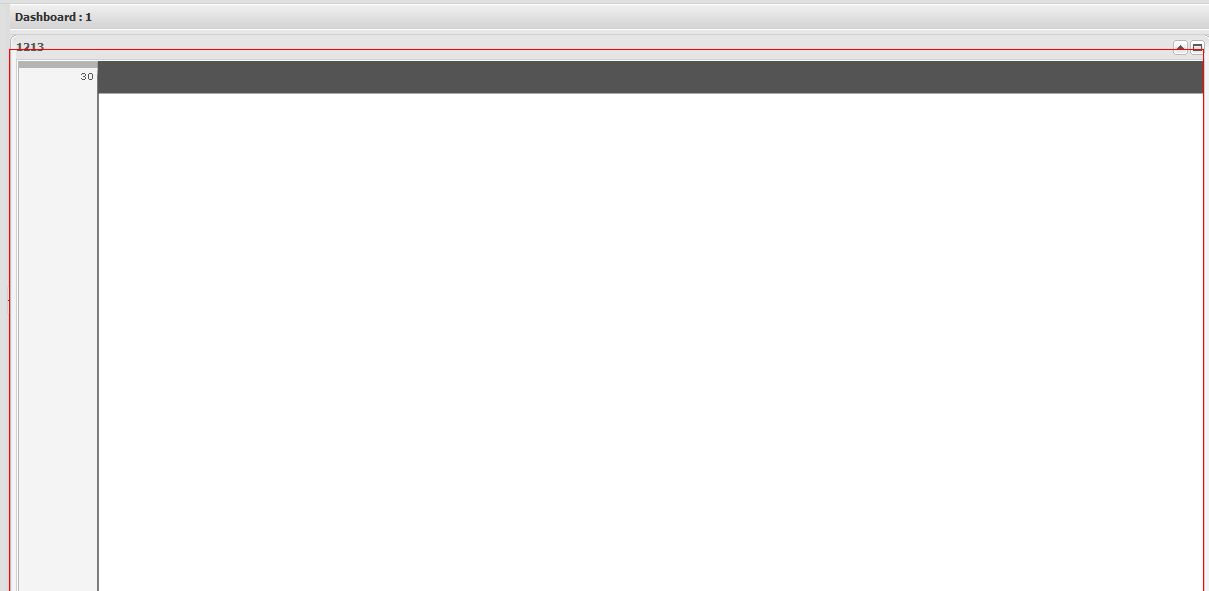
About first i upload 4 pictures.
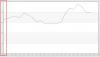
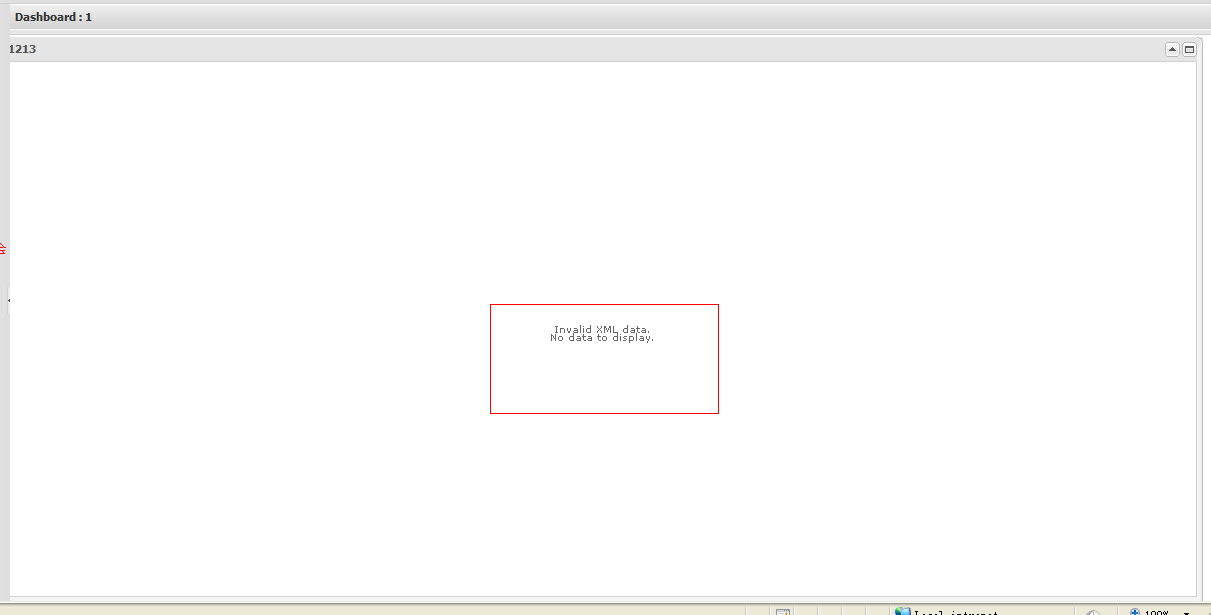
About Second i set adjustDiv='0' but there's a new problem...look the red area.....
-
Hi,
I have two questions.
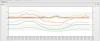
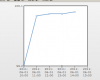
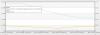
First:look at this two pictures ,when load the flash,it seems load too slow sometimes ,like 1.png and a moment later it will be normal.how can I solve or avoid the problem?

Second:
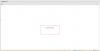
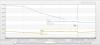
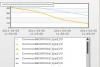
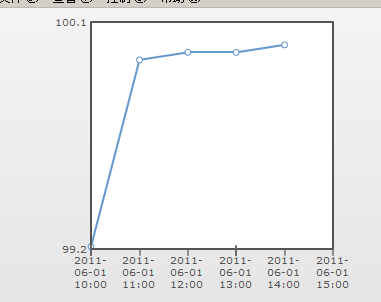
I use this data.xml and set PyAxisMinValue="99.2" ,PyAxisMaxValue="100" then the divLine is disappered like 4.png.how can I let the divLine back?
<?xml version="1.0" encoding="utf-8"?>
<chart showLegend="0" showYAxisValues="1" yAxisValuesStep="1"
showDivLineValues="1" labelStep="1" labelDisplay="WRAP"
showDivLineSecondaryValue="0" showSecondaryLimits="0"
chartRightMargin="60" chartLeftMargin="60" showValues="0"
canvasLeftMargin="45" canvasRightMargin="45" formatNumberScale="0"
plotBorderColor="#6699CC" plotGradientColor="#FCFCFC"
plotFillAngle="0" dynamicAxis="1" PyAxisMinValue="99.2"
PyAxisMaxValue="100" setAdaptiveYMin="1">
 <categories>
   <category label="2011-06-01 10:00" />
   <category label="2011-06-01 11:00" />
   <category label="2011-06-01 12:00" />
   <category label="2011-06-01 13:00" />
   <category label="2011-06-01 14:00" />
   <category label="2011-06-01 15:00" />
 </categories>
 <dataset ID="3" seriesName="E439,(M)CSSR_Mobily" color="#6699CC"
 renderAs="Line" parentYAxis="P">
   <set ID="0" value="99.21" toolText="99.92" />
   <set ID="1" value="99.95" toolText="95.95" />
   <set ID="2" value="99.98" toolText="99.98" />
   <set ID="3" value="99.98" toolText="99.98" />
   <set ID="4" value="100.01" toolText="99.97" />
 </dataset>
</chart>
-
thanks,Angie,I looked the documents ,but I'm not find what I want .......
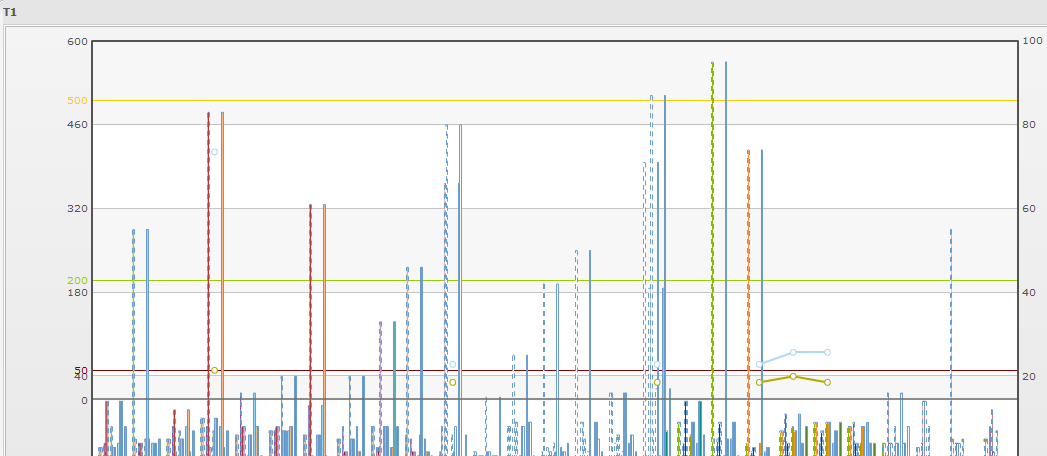
i just want when my mouse over the rounds then display the value of what my mouse point , zoomline.swf seems different with other template ,i don't know how to do ..........
Hi,
Welcome to FusionCharts Forum!
For more details, please refer to the link: http://www.fusioncha...sc/ToolTip.html
Hope this helps.
-
Hi,
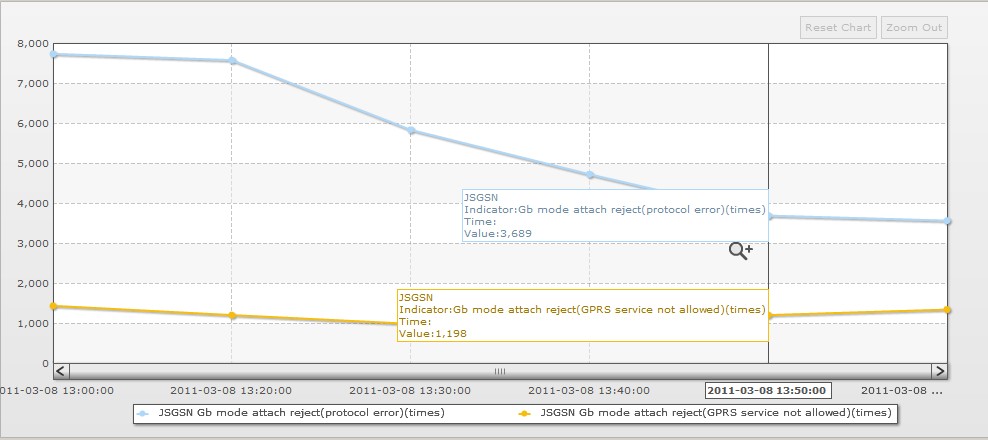
Is there an attribute in zoomline.swf to display tooltip like picture2 (only mouse over the round then display it)?
because when i have a lot of lines it gets on my nerves........
if there's an attribute can control the style is good.
thank you~
-
Hi
I get a problem...
<dataset seriesName=' S1'>
<set id='S1_1' value='50.00' toolText=' AAAAAAAAAAAAAAAAAAAAAAAAAAAAA' />
<set id='S1_2' value='50.00' toolText=' BBBBBBBBBBBBBBBBBBBBBBBBBBBBB' />
</dataset>
<dataset seriesName=' S2' >
<set id='S2_1' value='50.00' toolText='XXXXXXXXXXXXXXXXXXXXXX' />
<set id='S2_2' value='40.00' toolText='CCCCCCCCCCCCCCCCCCC' />
</dataset>
when set "S1_1" 's value equal "S2_2" 's value
"S2_2" 's tooltip will cover "S1_1' 's
then users can't see S1_1 's tip
 is there an attribute can show them all?
or i need concat s1_1 and s2_2's tip
so sorry for my poor english.......
-
Hi,
Welcome to FusionCharts Forum!
Please try the same by setting <showDivLineSecondaryValue='0'> and <showSecondaryLimits='0'> attribute inside the <chart> element.
Hope this helps.
Thank you very much~ -
Hi,
I want to know when i use "MSCombiDY2D.swf" is there an attribute to hide secondary Y axis? thank you.
-
ZoomLine Template can not support the "labelStep" Attribute?
I set labelStep = '4' ,but it doesn't work
use msLine Template it can be work well
-
Hi,
Welcome to FusionCharts Forum!
I am afraid, zoomline chart does not support dual y axis, at this time.
I think Dual Combination chart will suffice your requirement.
For more details, please refer to the link: http://www.fusioncha...ol3DLineDY.html
Hope this helps.
Thanks for your help,
Dual Combination chart can suffice my requirement but it can't zoom in/zoom out....................

-
Hi,
i want to add two Y axis .so i can compare two different measurement lines.
I tried add parentYAxis='S' on dataset node ,but it doesn't work.can zoonline template support two Y axis?
who can help me? thank you.
-
Hi,
I have three requirement,it seems need MultiAxisLine + ZoomLine,but i want to use in one template.how should i do?
*Dynamic Graphs 1: when a report graph is generated, it should be possible to zoom and dynamically in the graphical user interface to examine particular timeframes in greater granularity (without regenerating the graphs)
*Dynamic Graphs 2: when a report graph is generated, it should be possible to add and remove KPIs or particular measurement objects to graphs dynamically to enable comparisons of multiple KPIs over different measurement objects (without regenerating the graphs)
*Dynamic Graphs 3: when a report graph is generated, it should be possible to assign elements dynamically to different Y axes and change the scale of the X and Y axes dynamically (without regenerating the graphs)


How To Remove Gradual Change
in FusionCharts and JSP
Posted · Edited by LeonWood · Report reply
Hi
I don't want gradual change in my 2D-COLUMN graph,how to remove this style,thanks.