
Lo
-
Content count
5 -
Joined
-
Last visited
Posts posted by Lo
-
-
Hi, thank you for you hint.
I tried but it changed nothing.
I tried both as graph and dataset property.
Lo
-
Hi,
But is it possible to set a fix width ?
Thank you,
Lo
-
Hi,
Ihave the same need I think, and with PHP, you can display dates in the format you want and choose to alternate the showing.
In my case I have to graph plots on a period of 6 hours.
I put a category per minute, and display every 30 min on the x-axis.
Lo
-
Hello,
I started using your tool, 2 days ago, I am stunned how it is complete !
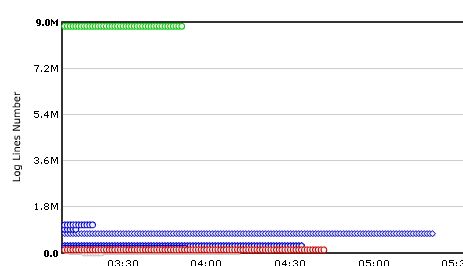
I am using Multiseries Line 2D, and a lot of categories, thus a lot of point per line.
I would like to hide the plot on lines, because it makes the line to thick(see snapshot) . Is it possible ?
I searched on forums and FAQ, and also played with lineThickness, or showNames, showValue but I can get the plot disapear.
Thanks for your help !
Lo

Hide plot in Line graph
in General usage
Posted · Report reply
Oups, sorry, I made a little error, this solution is working, thanks a lot !
Lo