
kaiwachter
-
Content count
27 -
Joined
-
Last visited
Posts posted by kaiwachter
-
-
Hi guys, we like your products they are very smart. but you didn't release any major updates for your powercharts since more than a year.
Do you have any release plans for powercharts and also Fusioncharts?
Currently we missing some nice features:
- More chart types that support drag of datapoints (scatter, bubble, barchart, pie, radar etc.)
- autlayout for Dragnode
- more javascript events
Thanks for any update.
best regards
Kai
-
Hi guys,
we like your products they are very smart. but you didn't release any major updates for your powercharts since more than a year.
Do you have any release plans for powercharts and also Fusioncharts?
Currently we missing some nice features:
- More chart types that support drag of datapoints (scatter, bubble, barchart, pie, radar etc.)
- autlayout for Dragnode
- more javascript events
Thanks for any update.
best regards
Kai
-
Hi Fusioncharts Team,i highl y appreciated fusioncharts for vb. Do you have an Feature or release plan for a new version.
For a product prototype we require more functionality, especially we require the Powercharts and widgets. Any Plans to support them?
Thanks for the information.
best regards,
Kai
-
Hi Pallav,
will they be available in Version V4 of fusioncharts and also can i commit the time of V4 for Q2.2009 to my customer, or can this date be changed?
Thanks for support.
best regards,
Kai
-
Hi Guys,
We are using the scatter Chart to display Data. If two points come to nearly same point in the chart the lables lay over each other, and it is impossible to view read them.
Is there any way that the labels get next to each other and a line points to the point?
<chart Caption='' subCaption='' xAxisname='NGU in TEuro' rotateValues='1' yAxisname='DB5 dg. in TEuro' SYAxisName='!SYAXISNAME' UseRoundEdges='0' Palette='0' showlegend='1' showFCMenuItem='0' formatNumber='1' numberPrefix='' numberSuffix='' decimals='0' forceDecimals='0' formatNumberScale='0' defaultNumberScale='' numberScaleUnit='' numberScaleValue='' scaleRecursively='0' maxScaleRecursion='0' scaleSeparator='' decimalSeparator='' thousandSeparator='' inDecimalSeparator='' inThousandSeparator='' bgColor='FFFFFF,FFFFFF' bgAlpha='100' bgRatio='0' bgAngle='0' showBorder='0' borderColor='000000' borderThickness='0' borderAlpha='100' bgSWF='' bgSWFAlpha='0' showLabels='1' showLabelsAtCenter='1' labelDistance='20' labelSepChar='' enableSmartLabels='1' smartLineColor='000000' smartLineThickness='2' smartLineAlpha='100' showValues='0' showPercentValues='0' percentOfPrevious='0' showToolTip='1' showPercentInToolTip='0' toolTipBgColor='D3D3D3' toolTipBorderColor='808080' toolTipSepChar='' >
<categories>
<category label='500000' x='500000'/>
<category label='366000' x='366000'/>
<category label='232000' x='232000'/>
<category label='98000' x='98000'/>
</categories>
<dataset labelAsValues='1' showvalues='1' seriesName='Lorenz' renderas='Line'parentYAxis='P' drawLine='1'>
<set x='0' y='0' toolText=' ' label='' />
<set x='97845.74300000' y='68005.22720000' z='0' label='HEATING' toolText='HEATING />
<set x='116150.67800000' y='78346.76863000' z='0' label='HEATING 2' toolText='HEATING 2' />
<set x='196000.67800000' y='121711.89391000' z='0' label='MERCHANDISE' toolText='' />
<set x='277372.43800000' y='160396.10714000' z='0' label='STORAGE' toolText='STORAGE' />
<set x='387991.69300000' y='210333.83490000' z='0' label='GAS' toolText='GAS' />
<set x='445065.53651000' y='231207.35014000' z='0' label='SOLAR' toolText='SOLAR' />
<set x='445372.70349000' y='231230.12825000' z='0' label='OTHERS' toolText='OTHERS' />
<set x='445933.35949000' y='230899.06071000' z='0' label='ELECTRIC' toolText='ELECTRIC' />
<set x='445946.76109000' y='230889.16522000' z='0' label='SPARE PARTS' toolText='SPARE PARTS' />
<set x='446008.30509000' y='230542.84641000' z='0' label='RADIATORS' toolText='RADIATORS' />
<set x='550143.18009000' y='275990.88155000' label='Not Assigned' toolText='Not Assigned' />
</dataset>
<trendlines><line StartValue='0' EndValue='0' DisplayValue='' color='000000' Thickness='1' isTrendzone='0' parentYAxis='P' /></trendlines></chart>
best regards
Kai
-
Hi Folks,
We are using the Scatter chart and we are specifying the value x and y.
From my perspective it makes no sense to display the y-Value if you activate the ShowValue='1' as you are x and y represent the Axis values it make even more sense to display a label at the point in the scatter.
<dataset seriesName='Hans Dampf' >
<set x='51672.2000' y='35636' toolText='root3' />
<set x='67775.9' y='46742' toolText='root1' />
<set x='17553.7' y='12106' toolText='Not Assigned Sold-to party (s)' />
</dataset>
The sample above explains the problem:
you have one series with 3 values in the scatter. Each value will be blue. Only if you move over the point you will see the description.
For normal charts this behaviour is correct but for scatter of bubble it is non-sense. And without a data table it is not possible to identify your points if you print the chart.
The <set..> must be enhanced like this:
<set x='67775.9' y='46742' label='Root1' showlabel='1' toolText='root1' />
Please provide a updated Scatter.swf
best regards
Kai
Kai
-
Hi guys,
we are using Dragnode Chart to display a ord chart. Sometimes the labels are longer. we are experiencing some Strange behaviours with the labels. If the lables are are wider the then the nodes they will be wrapped into the next line. If the height of the node is not enough the text will be cut-off. Is there a setting which enables the wrap only to take place on spaces and also that the labels can flow of the node boundaries?
best regards,
Kai
-
Hi Pallav,
If you have a chart e.g. a Pie. And this pie consist out of 20 Slices. Now you would like to have a legend, but the pie does not support a legend. So i thought to use the ssgrid swf, but here comes the problem. initially the grid shows only 10 values, the rest on a second page. But you can also set the numer of values on page. But in that case the size would be to tall for the use in a dashboard. normally a legend shows only the color of the slice and the name of the series, but supports multiple columns.
So the demand is:
it must contain initially all slices nicluding the correct color.
it must possible to customize the number of columns
it must be possible to display also the value or percentage behind
So we have a big need of a legend component, in general we would be interested in buying such a component, or pay the development for such one.
Could you be able to provide such one?
One Addition to this issue. In general the best solution would be if all your charts would support customizable legends like Excel does for example.
Best regards,
Kai
-
Hi Fusioncharts,
In some cases it is neccessary to provide a legend. We use the ssgrid for that purpose. But if you have more than a few values the list is getting quite huge, because it is not possible to have a multiple column layout.
Also the pagination is not possible, because it will not print the whole list.
Do you have plans to provide such a feature?
best regards,
Kai
-
Hi i like the fusioncharts products.
But i have one requirement which would be quite easier, if it would be implemented in your Dragnode Flash. I have list of circles and list of connectors which indicates the reference between 2 bubbles. It would be nice if the Drag node would have some sort of Autolayout option.
i know such a automatic Layout mode from .Net Component of Sysncfusion:
it would be quite cool if your tool could offer such a feature as well. It make the generation of graphes much easier.
Feedback is welcome.
best regards,
Kai
-
Hi Guys,
i have a problem. If i place a fusionchart in a hidden DIV tag i throws an Error message "error in Loading" in Firefox it works. Any hint how tpo avoid?
best regards,
Kai
-
Hi Pallav,
the second one looks like tough problem. If you do further navigation on the page it is renders sometimes good again but if you navigate one step further is breaks down again.
best regards,
Kai
-
does this mean if i set the numeric scale to the width of the charts, my x values will represent pixels?
best regards,
Kai
-
Hi Pallav,
do you have any news on my two issues?
best regards,
Kai
-
Hi ,
i have a problem with x coords:
<script type="text/javascript">
var chart1 = new FusionCharts("/sap/bw/mime/customer/ibs/charting/DragNode.swf", "DRAGWEBITEM_1", "995", "400 ", "0", "0");
chart1.setDataXML("
<chart palette='2' is3D='1' showFormBtn='0' enableLink='1' viewMode='0'>
<dataset>
<set x='265' y='380' width='60' height='30' name='2006' link='/sap/bw/BEx?SAP-LANGUAGE%3dE%26PAGENO%3d1%26%26ITEM%3dWEBITEM_1%26PCMD%3dSWITCH_TIME_VAL%26TIME%3d2006' shape='rectangle' id='2006' color=''/>
<set x='200' y='380' width='60' height='30' name='2005' link='/sap/bw/BEx?SAP-LANGUAGE%3dE%26PAGENO%3d1%26%26ITEM%3dWEBITEM_1%26PCMD%3dSWITCH_TIME_VAL%26TIME%3d2005' shape='rectangle' id='2005' color=''/>
<set x='135' y='380' width='60' height='30' name='2004' link='/sap/bw/BEx?SAP-LANGUAGE%3dE%26PAGENO%3d1%26%26ITEM%3dWEBITEM_1%26PCMD%3dSWITCH_TIME_VAL%26TIME%3d2004' shape='rectangle' id='2004' color=''/>
<set x='70' y='380' width='60' height='30' name='2003' link='/sap/bw/BEx?SAP-LANGUAGE%3dE%26PAGENO%3d1%26%26ITEM%3dWEBITEM_1%26PCMD%3dSWITCH_TIME_VAL%26TIME%3d2003' shape='rectangle' id='2003' color=''/>
<set x='478' y='297' radius='40' height='65' name='Overall' link='' shape='polygon' id='8970ec7d337348b3880881eca6df9771' color='F87C7C'/>
<set x='623' y='212' radius='40' height='65' name='erste perspektive' link='' shape='polygon' id='4381fb01f7f44b8e866d6fb89e5a91c1' color='FFBBBB'/>
<set x='312' y='212' radius='40' height='65' name='Zweite Perspektive' link='' shape='polygon' id='01bc265a18c74a088f65e7377a935fa7' color='FF3333'/>
<set x='686' y='127' radius='30' height='65' name='Thilo Test' link='/sap/bw/BEx?SAP-LANGUAGE%3dE%26PAGENO%3d1%26%26ITEM%3dWEBITEM_1%26PCMD%3dSHOW_KPI%26KPI_ID%3db1d2d51939424b37bd9263b5f3cd19c0' shape='circle' id='b1d2d51939424b37bd9263b5f3cd19c0' color='FFBBBB'/>
<set x='458' y='127' width='40' height='65' name='mein Folder' link='' shape='rectangle' id='2c0f47d22c62410c83c558f5887abbe3' color='FFBBBB'/>
<set x='229' y='127' width='40' height='65' name='Test Folder in neuer Pers' link='' shape='rectangle' id='ab9793539db24d9a8e4d07599f6e4039' color='FF3333'/>
<set x='623' y='42' radius='30' height='65' name='mein Test' link='/sap/bw/BEx?SAP-LANGUAGE%3dE%26PAGENO%3d1%26%26ITEM%3dWEBITEM_1%26PCMD%3dSHOW_KPI%26KPI_ID%3d1073f6af475f49c2bb98510a0a2775e7' shape='circle' id='1073f6af475f49c2bb98510a0a2775e7' color='FFBBBB'/>
<set x='312' y='42' radius='30' height='65' name='dadfasfadf' link='/sap/bw/BEx?SAP-LANGUAGE%3dE%26PAGENO%3d1%26%26ITEM%3dWEBITEM_1%26PCMD%3dSHOW_KPI%26KPI_ID%3d78b673c026474f66b4a91a542549d723' shape='circle' id='78b673c026474f66b4a91a542549d723' color='FF3333'/>
</dataset>
<connectors>
<connector from='8970ec7d337348b3880881eca6df9771' to='01bc265a18c74a088f65e7377a935fa7' color='' arrowAtStart='0' arrowAtEnd='1'/>
<connector from='01bc265a18c74a088f65e7377a935fa7' to='ab9793539db24d9a8e4d07599f6e4039' color='' arrowAtStart='0' arrowAtEnd='1'/>
<connector from='ab9793539db24d9a8e4d07599f6e4039' to='78b673c026474f66b4a91a542549d723' color='' arrowAtStart='0' arrowAtEnd='1'/>
<connector from='8970ec7d337348b3880881eca6df9771' to='4381fb01f7f44b8e866d6fb89e5a91c1' color='' arrowAtStart='0' arrowAtEnd='1'/>
<connector from='4381fb01f7f44b8e866d6fb89e5a91c1' to='2c0f47d22c62410c83c558f5887abbe3' color='' arrowAtStart='0' arrowAtEnd='1'/>
<connector from='2c0f47d22c62410c83c558f5887abbe3' to='1073f6af475f49c2bb98510a0a2775e7' color='' arrowAtStart='0' arrowAtEnd='1'/>
<connector from='4381fb01f7f44b8e866d6fb89e5a91c1' to='b1d2d51939424b37bd9263b5f3cd19c0' color='' arrowAtStart='0' arrowAtEnd='1'/>
</connectors></chart>
");chart1.render("divDRAGWEBITEM_1");
</script>
All the nodes change the xCoords.
<set x='478' y='297' radius='40' height='65' name='Overall' link='' shape='polygon' id='8970ec7d337348b3880881eca6df9771' color='F87C7C'/>
the chart is 995px wide i set the x coord to 478px. so i would expect that it looks more or less in the mid of the chart. but when executing it is on the right side. If i measure with ruler i can see that is rendered on approx 660px. Y coords are correct.
Can you help me to find the root cause?
best regards
Kai
-
One addition. The problem does not occur in Firefox. I am using IE7.
best regards,
kai
-
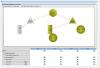
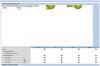
all nodes are in one line on top. the x/y values are ignored all nodes and connectors are present but you can't drag them belo mid of chart.
You will see if you execute.
i attached two screenshots
best regards
kai
-
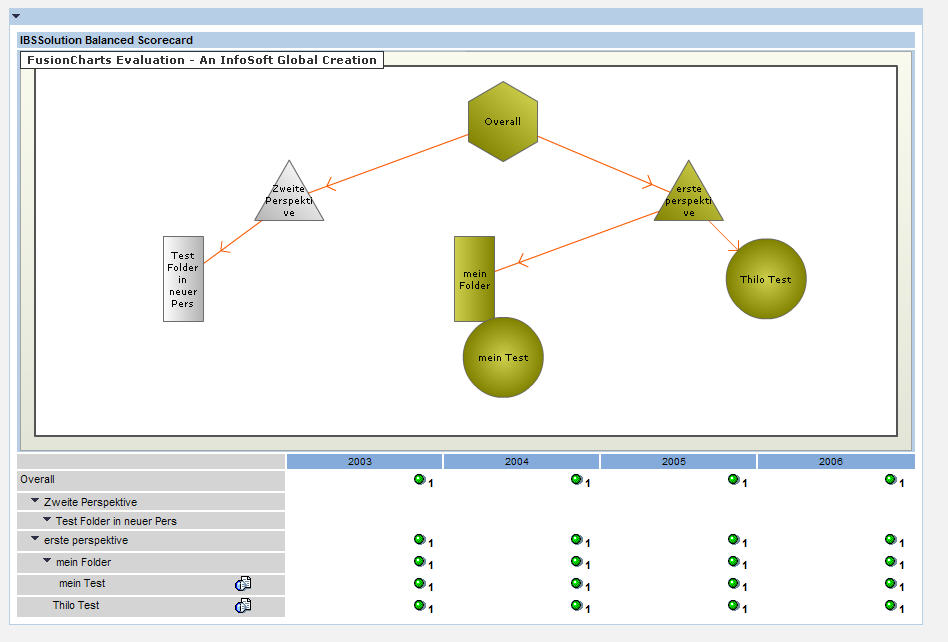
Hi Guys,
i have the following Problem.
When i execute the following URL http://kaiwachter.dyndns.org:8000/sap/bw/BEx?sap-language=EN&bsplanguage=EN&CMD=LDOC&TEMPLATE_ID=ZSCORDEVEL the first view is okay. Then i navigate inside the page e.g. click on the icon next of "mein test" then the layout of the dragnode chart is currupted:
in both cases the XML look like this:
<chart palette='2' is3D='1' showFormBtn='0' viewMode='0'>
<dataset>
<set x='426' y='340' radius='40' height='85' name='Overall' link='' shape='polygon' numsides='6' id='8970ec7d337348b3880881eca6df9771' color='BBBB00'/>
<set x='277' y='255' radius='40' height='85' name='Zweite Perspektive' link='' shape='polygon' numsides='3' id='01bc265a18c74a088f65e7377a935fa7' color='FFFFFF'/>
<set x='555' y='255' radius='40' height='85' name='erste perspektive' link='' shape='polygon' numsides='3' id='4381fb01f7f44b8e866d6fb89e5a91c1' color='BBBB00'/>
<set x='203' y='170' width='40' height='85' name='Test Folder in neuer Pers' link='' shape='rectangle' numsides='' id='ab9793539db24d9a8e4d07599f6e4039' color='FFFFFF'/>
<set x='406' y='170' width='40' height='85' name='mein Folder' link='' shape='rectangle' numsides='' id='2c0f47d22c62410c83c558f5887abbe3' color='BBBB00'/>
<set x='609' y='170' radius='40' height='85' name='Thilo Test' link='' shape='circle' numsides='' id='b1d2d51939424b37bd9263b5f3cd19c0' color='BBBB00'/>
<set x='426' y='85' radius='40' height='85' name='mein Test' link='' shape='circle' numsides='' id='1073f6af475f49c2bb98510a0a2775e7' color='BBBB00'/>
</dataset>
<connectors>
<connector from='8970ec7d337348b3880881eca6df9771' to='01bc265a18c74a088f65e7377a935fa7' color='' arrowAtStart='0' arrowAtEnd='1'/>
<connector from='01bc265a18c74a088f65e7377a935fa7' to='ab9793539db24d9a8e4d07599f6e4039' color='' arrowAtStart='0' arrowAtEnd='1'/>
<connector from='8970ec7d337348b3880881eca6df9771' to='4381fb01f7f44b8e866d6fb89e5a91c1' color='' arrowAtStart='0' arrowAtEnd='1'/>
<connector from='4381fb01f7f44b8e866d6fb89e5a91c1' to='2c0f47d22c62410c83c558f5887abbe3' color='' arrowAtStart='0' arrowAtEnd='1'/>
<connector from='2c0f47d22c62410c83c558f5887abbe3' to='1073f6af475f49c2bb98510a0a2775e7' color='' arrowAtStart='0' arrowAtEnd='1'/>
<connector from='4381fb01f7f44b8e866d6fb89e5a91c1' to='b1d2d51939424b37bd9263b5f3cd19c0' color='' arrowAtStart='0' arrowAtEnd='1'/>
</connectors>
</chart>
I am using Javascript embedding:
<div id="divDRAGWEBITEM_1">IBS Solution Flash Chart </div><script type="text/javascript">var chart1 = new FusionCharts("/sap/bw/mime/customer/ibs/charting/DragNode.swf", "DRAGWEBITEM_1", "892", "400 ", "0", "0");chart1.setDataXML("<chart palette='2' is3D='1' showFormBtn='0' viewMode='0'><dataset><set x='426' y='340' radius='40' height='85' name='Overall' link='' shape='polygon' numsides='6' id='8970ec7d337348b3880881eca6df9771' color='BBBB00'/><set x='277' y='255' radius='40' height='85' name='Zweite Perspektive' link='' shape='polygon' numsides='3' id='01bc265a18c74a088f65e7377a935fa7' color='FFFFFF'/><set x='555' y='255' radius='40' height='85' name='erste perspektive' link='' shape='polygon' numsides='3' id='4381fb01f7f44b8e866d6fb89e5a91c1' color='BBBB00'/><set x='203' y='170' width='40' height='85' name='Test Folder in neuer Pers' link='' shape='rectangle' numsides='' id='ab9793539db24d9a8e4d07599f6e4039' color='FFFFFF'/><set x='406' y='170' width='40' height='85' name='mein Folder' link='' shape='rectangle' numsides='' id='2c0f47d22c62410c83c558f5887abbe3' color='BBBB00'/><set x='609' y='170' radius='40' height='85' name='Thilo Test' link='' shape='circle' numsides='' id='b1d2d51939424b37bd9263b5f3cd19c0' color='BBBB00'/><set x='426' y='85' radius='40' height='85' name='mein Test' link='' shape='circle' numsides='' id='1073f6af475f49c2bb98510a0a2775e7' color='BBBB00'/></dataset><connectors><connector from='8970ec7d337348b3880881eca6df9771' to='01bc265a18c74a088f65e7377a935fa7' color='' arrowAtStart='0' arrowAtEnd='1'/><connector from='01bc265a18c74a088f65e7377a935fa7' to='ab9793539db24d9a8e4d07599f6e4039' color='' arrowAtStart='0' arrowAtEnd='1'/><connector from='8970ec7d337348b3880881eca6df9771' to='4381fb01f7f44b8e866d6fb89e5a91c1' color='' arrowAtStart='0' arrowAtEnd='1'/><connector from='4381fb01f7f44b8e866d6fb89e5a91c1' to='2c0f47d22c62410c83c558f5887abbe3' color='' arrowAtStart='0' arrowAtEnd='1'/><connector from='2c0f47d22c62410c83c558f5887abbe3' to='1073f6af475f49c2bb98510a0a2775e7' color='' arrowAtStart='0' arrowAtEnd='1'/><connector from='4381fb01f7f44b8e866d6fb89e5a91c1' to='b1d2d51939424b37bd9263b5f3cd19c0' color='' arrowAtStart='0' arrowAtEnd='1'/></connectors></chart>");chart1.render("divDRAGWEBITEM_1");</script>
thanks for your help.
best regards
kai
-
Hi Guys,
is it possible to set a parameter to render the charts without any animations, so that it appear like a picture.
i need that functionality to develop a full page print including these charts. waiting for the animations finish is a unneccessary time delay.
best regards,
Kai
-
Hi pallav,
due to the restrictions of the environment i am working with i need to provide the XML. But i fixed that problem on my own by escaping the " in Link with ". This works fine.
best regards,
Kai Wachter
-
Hi Pallav,
after Installing Version 3.04 it works fine. It seems that you fixed that bug in that version.
Best reagards,
Kai Wachter
-
Hi Guys,
i have problem in implementing dynamic Drill Down Maps. Below is the script i am trying to overhand to the map. the user should be able click on a country. due to server limitations it is not possible to have a static XML File like described in you how-to.
<script type="text/javascript">
var chart1 = new FusionMaps("/sap/bw/mime/customer/ibs/maps/FCMap_Europe.swf", "WEBITEM_2", "635", "452", "0", "0");
chart1.setDataXML("<Map animation='0' showLables='1' includeNameInLabels='1' includeValueInLabels='0' showShadow='1' showBevel='1' defaultAnimation='1'><data><entity value='4687' id='014' color='' link="WEB_ITEM_1_DrillDownForChar('DE','OD_REGION','DATAPROVIDER_2','OD_COUNTRY','FCMap_Germany.swf');" /><entity value='844' id='014' color='' link="WEB_ITEM_1_DrillDownForChar('DI','OD_REGION','DATAPROVIDER_2','OD_COUNTRY','FCMap_Germany.swf');" /><entity value='5113' id='010' color='' link="WEB_ITEM_1_DrillDownForChar('DK','OD_REGION','DATAPROVIDER_2','OD_COUNTRY','FCMap_Germany.swf');" /><entity value='740' id='010' color='' link="WEB_ITEM_1_DrillDownForChar('DO','OD_REGION','DATAPROVIDER_2','OD_COUNTRY','FCMap_Germany.swf');" /><entity value='5130' id='038' color='' link="WEB_ITEM_1_DrillDownForChar('ES','OD_REGION','DATAPROVIDER_2','OD_COUNTRY','FCMap_Germany.swf');" /><entity value='568' id='013' color='' link="WEB_ITEM_1_DrillDownForChar('FR','OD_REGION','DATAPROVIDER_2','OD_COUNTRY','FCMap_Germany.swf');" /><entity value='4889' id='019' color='' link="WEB_ITEM_1_DrillDownForChar('IT','OD_REGION','DATAPROVIDER_2','OD_COUNTRY','FCMap_Germany.swf');" /><entity value='922' id='019' color='' link="WEB_ITEM_1_DrillDownForChar('MI','OD_REGION','DATAPROVIDER_2','OD_COUNTRY','FCMap_Germany.swf');" /><entity value='975' id='028' color='' link="WEB_ITEM_1_DrillDownForChar('MO','OD_REGION','DATAPROVIDER_2','OD_COUNTRY','FCMap_Germany.swf');" /><entity value='4625' id='029' color='' link="WEB_ITEM_1_DrillDownForChar('NL','OD_REGION','DATAPROVIDER_2','OD_COUNTRY','FCMap_Germany.swf');" /><entity value='4347' id='031' color='' link="WEB_ITEM_1_DrillDownForChar('PL','OD_REGION','DATAPROVIDER_2','OD_COUNTRY','FCMap_Germany.swf');" /><entity value='4737' id='046' color='' link="WEB_ITEM_1_DrillDownForChar('RU','OD_REGION','DATAPROVIDER_2','OD_COUNTRY','FCMap_Germany.swf');" /><entity value='606' id='046' color='' link="WEB_ITEM_1_DrillDownForChar('SA','OD_REGION','DATAPROVIDER_2','OD_COUNTRY','FCMap_Germany.swf');" /><entity value='4503' id='039' color='' link="WEB_ITEM_1_DrillDownForChar('SE','OD_REGION','DATAPROVIDER_2','OD_COUNTRY','FCMap_Germany.swf');" /><entity value='595' id='039' color='' link="WEB_ITEM_1_DrillDownForChar('SO','OD_REGION','DATAPROVIDER_2','OD_COUNTRY','FCMap_Germany.swf');" /><entity value='3961' id='042' color='' link="WEB_ITEM_1_DrillDownForChar('UK','OD_REGION','DATAPROVIDER_2','OD_COUNTRY','FCMap_Germany.swf');" /><entity value='47242' id='042' color='' link="WEB_ITEM_1_DrillDownForChar('Overall Result','OD_REGION','DATAPROVIDER_2','OD_COUNTRY','FCMap_Germany.swf');" /></data><colorRange><color minValue='0' maxValue='600' DisplayValue='Lower than requested' color='FF0000' /><color minValue='600' maxValue='1000' DisplayValue='Less than Middle' color='FFC0C0' /><color minValue='1000' maxValue='4000' DisplayValue='Middle Bound' color='FF8000' /><color minValue='4000' maxValue='5000' DisplayValue='Okay' color='80FF80' /><color minValue='6000' maxValue='10000' DisplayValue='Excellent' color='00C000' /></colorRange></Map>");
chart1.render("divWEBITEM_2");</script>
but unfortunatelly the resulting HTML page results in Javascript errors. It mus be somehow escaped. Please assist.
best regards,
Kai Wachter
-
Hi GUys,
please refer to the following link.
This is a prototype of a application i am developing. But after the first navigation the the legend disappears.
Please Check.
Best regards,
Kai Wachter
-
Hi Pallav,
do you have a estimated Delivery Date for Instrumentation V3. We are highly interested in being a beta Tester. As some of our customers are really interested in Gauges, we would like to be an early adaptor. But due to our software design, it would be neccessary that the syntax of using istrumentation is nearly the same like in Fusioncharts, which is not the case in Instrumentation V2.
best regards,
Kai

Future Version and Drag Support
in Suggestions & Requests
Posted · Report reply
Hi,
thats great to hear. Any estimation when the next major release will be available? Also we would be proud to be Beta tester.
If you are interested on what we currently working with fusioncharts, you can watch a smal video on our web page:
http://biexcellencesuite.com/Solutions/BIOfficeeXcellence/BIOXScreencams/tabid/96/language/de-DE/Default.aspx
Watch the video, "use BI Data as flash graphics in Word" works in Excel, Powerpoint as well.
The Idea behind BIOX is to enable Business Intelligence in Microsoft Office applications. We have build a prototype now, which is also able to support planning processes. For that purpose we used the Fusioncharts powercharts and its drag support to change plan values. As there are currently only Drag Line, Drag Column and Drag Area available, we are looking forward to other charttypes as well. Can you provide some information which charttypes will support drag as well?
we absolutly like your products, and your support.
Best regards
Kai