
bhoffman17
-
Content count
21 -
Joined
-
Last visited
Posts posted by bhoffman17
-
-
Nobody knows how to do this one?
Thanks!
-
Oh thank you so much!
God Bless you!
Ben
-
How do i get the chart to rescale when i click off one of the data points in the legend.
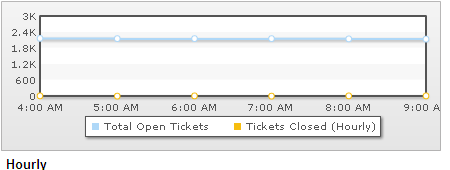
For example the above chart is showing data, but if i click off the blue line so i can get a better understanding of the yellow line.
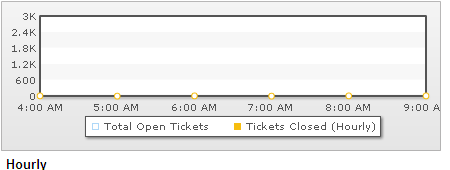
It stays the same it does not rescale. How would i achieve this effect?
God Bless!
Ben
-
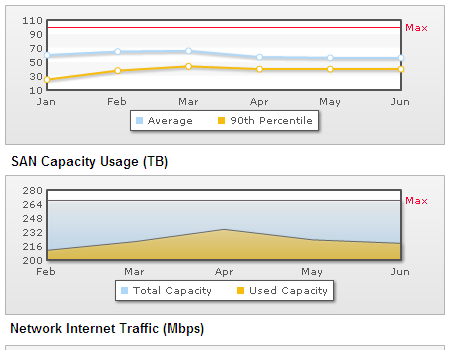
See the first chart has circles at the values then the area chart does not. I would like to know where the values are on the area chart. How do I enable the circle on the area chart?
Thanks!
God Bless!
Ben
-
I have a question i am using the real time area chart put it just shows the shape. I really want it to show the little circle to show the value (but not the number of the value) just the place.
How would I do this?
Thanks!
Ben
-
Nevermind the problem is solved! Real time charts work so so much better!
Thanks!
Ben
-
From the documentation I see that you have a real time angular guage but i dont see it, in our developer set of charts.
Does the regular angular guage have real time capabilities?
Thanks!
-
We have fusion charts for our dashboard and we have 2 guages that pull the temp and humidity from a database. We use an update panel to refresh every 5 minutes. This works great for a while but then the data doesn't appear to be correct anymore. If i close the browser and pull it back up it re syncs up and is correct.
Why does it do this? It is only the guages the real time charts always work.
What would be causing this problem? Is there a way to update the charts without an update panel?
God Bless!
Ben
-
I made a chart and it works great 2 questions though?
In the picture you see the legend is right up against the top how do i move it down so it is not covering the values. I see thats how the examples are.
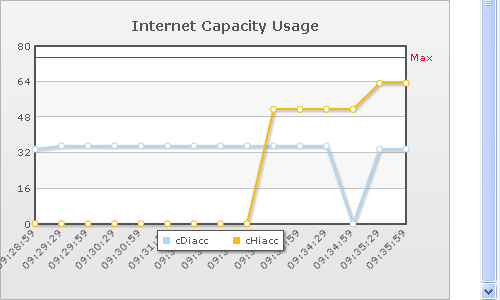
Aso how do i add another y value and another trend line. You see one line has a 75 max the other has a 45. Here is my code.
<chart caption='Internet Capacity Usage' dataStreamURL='InternetCapacity/InternetCap.aspx' legendPosition='BOTTOM' refreshInterval='30' setAdaptiveYMin='1' yAxisMaxValue='80' showRealTimeValue='0' realTimeValuePadding='50' chartBottomMargin='50' labelDisplay='Rotate' slantLabels='1'>
<categories>
</categories>
<dataset seriesName='cDiacc' showValues='0'>
</dataset>
<dataset seriesName='cHiacc' showValues='0'>
</dataset>
<trendlines>
<line startValue='75' displayValue='Max' valueOnRight='1' color='FF0033' />
</trendlines>
<styles>
<definition>
<style type='font' name='captionFont' size='14' />
</definition>
<application>
<apply toObject='Caption' styles='captionFont' />
<apply toObject='Realtimevalue' styles='captionFont' />
</application>
</styles>
</chart>
Thanks so much! God bless!
Ben
-
Actually i think everything is working now. Just had to re upload. Sorry for the panic.
God Bless!
Ben
-
OK i think i narrowed down the problem: here is the value that is getting passed to the chart:
&chartWidth=250&chartHeight=35&debugMode=0&dataURL=InfrastructureCapacity%2fSuperDome3.aspx
shouldn't that dataURL be InfrastructureCapacity/SuperDome3.aspx?
My code is:
string dataURL = Server.UrEncode("InfrastructureCapacity/SuperDome2.aspx");
//Create the chart with dataURL as strDataURL
return FusionCharts.RenderChartHTML("FusionWidgets/SparkLine.swf", dataURL, "", "SuperDome2Capacity", "250", "35", false);
So whats the problem?
THanks
Ben
-
ok i fixed that error but now it just loads and doesnt show the charts. It just keep loading.
What could be the issue?
THanks,
Ben
-
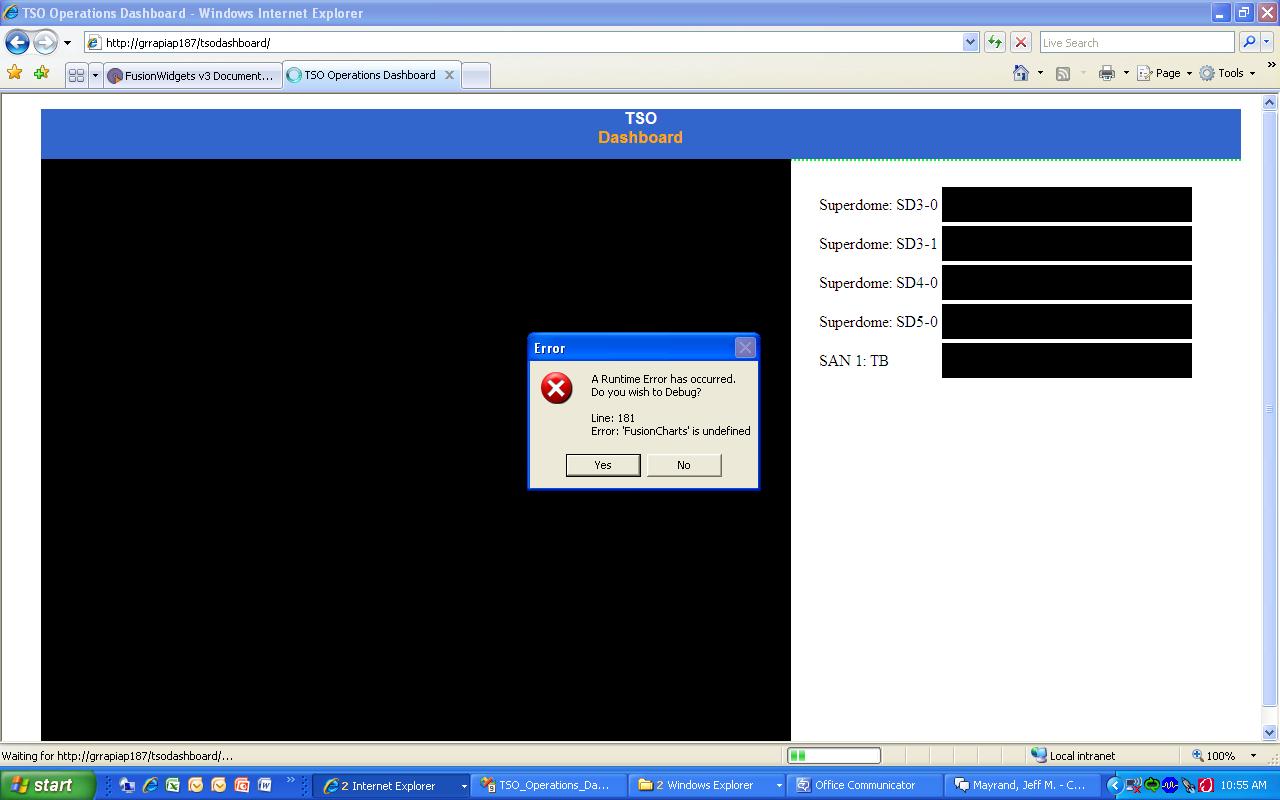
This is another problem i run in to. When i upload the files and try to look at the site i get fusioncharts is not defined. How do i fix this?
Thanks
-
WOW i didnt even know there was a debug option! That was amazing. The file path was wrong because the dataStream URL has to be relative to the page pulling the file, not where the XML file is located.
Thanks so much!
Ben
-
I have created a reatime line chart but the chart just sits there not plotting any data points. I have tested the InternetCap.aspx page and it provides this data which looks correct.
&label=5/19/2010 4:12:14 PM&value=7.553656E-05|2.6951024
Here is my dataprovider page InternetCap.aspx:
protected void Page_Load(object sender, EventArgs e)
{
string strSQL = "SELECT TOP 1 InterfaceTraffic.DateTime, Nodes.Caption, InterfaceTraffic.In_Averagebps " +
"FROM InterfaceTraffic join Nodes ON InterfaceTraffic.NodeID=Nodes.NodeID " +
"WHERE Nodes.Caption like 'cdiacc%' " +
"ORDER BY InterfaceTraffic.DateTime DESC";
SqlConnection objConnect = new SqlConnection(connString);
objConnect.Open();
SqlCommand objCommand = new SqlCommand(strSQL, objConnect);
SqlDataAdapter objAdapter = new SqlDataAdapter(objCommand); DataSet objDataSet = new DataSet();
objAdapter.Fill(objDataSet);
string strSQL2 = "SELECT TOP 1 InterfaceTraffic.DateTime, Nodes.Caption, InterfaceTraffic.In_Averagebps " +
"FROM InterfaceTraffic join Nodes ON InterfaceTraffic.NodeID=Nodes.NodeID " +
"WHERE Nodes.Caption like 'chiacc%' " +
"ORDER BY InterfaceTraffic.DateTime DESC";
SqlConnection objConnect2 = new SqlConnection(connString);
objConnect2.Open();
SqlCommand objCommand2 = new SqlCommand(strSQL2, objConnect2);
SqlDataAdapter objAdapter2 = new SqlDataAdapter(objCommand2); DataSet objDataSet2 = new DataSet();
objAdapter2.Fill(objDataSet2);
string newtest = objDataSet.Tables[0].Rows[0][2].ToString();
double cdiaccbps = double.Parse(newtest);
double cdiaccMBps = cdiaccbps / 12500000;
string newtest2 = objDataSet2.Tables[0].Rows[0][2].ToString();
double chiaccbps = double.Parse(newtest2);
double chiaccMBps = chiaccbps / 12500000;
//TestCode Response.Write(DateTime.Now + " " + objDataSet.Tables[0].Rows[0][1] + " " + cdiaccMBps + " MBps<br>");
//TestCode Response.Write(objDataSet2.Tables[0].Rows[0][0] + " " + objDataSet2.Tables[0].Rows[0][1] + " " + chiaccMBps + " MBps<br>");
Response.Write("&label=" + DateTime.Now + "&value=" + cdiaccMBps + "|" + chiaccMBps);
 objConnect.Close();
objConnect.Dispose();
objConnect2.Close();
objConnect2.Dispose();
}
Here is my xml file:
<chart caption='Internet Capacity Usage' subCaption='Mbps' dataStreamURL='InternetCap.aspx' refreshInterval='5' setAdaptiveYMin='1' xAxisName='Time' showRealTimeValue='1' realTimeValuePadding='50' labelDisplay='Rotate' slantLabels='1'>
<categories>
</categories>
<dataset seriesName='cDiacc' showValues='0'>
</dataset>
<dataset seriesName='cHiacc' showValues='0'>
</dataset>
<styles>
<definition>
<style type='font' name='captionFont' size='14' />
</definition>
<application>
<apply toObject='Caption' styles='captionFont' />
<apply toObject='Realtimevalue' styles='captionFont' />
</application>
</styles>
</chart>
and here is my defult.aspx code just for chart:
<div id="Chart5">
</div>
<script type="text/javascript">
var internetCap = new FusionCharts("../FusionWidgets/RealTimeLineDY.swf", "internetCap", "450", "300", "0", "0");
internetCap.setDataURL("../InternetCapacity/InternetData.xml");
internetCap.render("Chart5");
</script>
I have the .js files linked to so i know its not that. Please help this chart looks amazingly useful.
Ben
-
Thank you so much!!!
-
How would i rewrite list to update using javascript? Please help me!
I am calling the chart to page using: on default.aspx
Code behind page is:
public string GetInfrastructureCapacityURL(){
String dataURL = Server.UrlEncode("dataURL_Infrasturcture_Capacity.aspx");
//Create the chart - Pie 3D Chart with dataURL as strDataURL
return FusionCharts.RenderChart("../FusionCharts/Column3D.swf", dataURL, "", "FactorySum", "600", "300", false, false);}
On the data_URL_Infrasturcture_Capacity.aspx this is the code:
string connString = "Data Source=.SQLEXPRESS;AttachDbFilename=|DataDirectory|Inf_Cap.mdf;Integrated Security=True;User Instance=True"; // OLD LINK Data Source=HECND7261TRBSQLEXPRESS;database=TestDatabase; UID=dbtest;PWD=87JamesH string strSQL = "SELECT TOP 6 Date = CONVERT(varchar(8), Date, 1), Used_Cap " + "FROM Inf_Cap_Monthly " + "ORDER BY Date Desc "; SqlConnection objConnect = new SqlConnection(connString);objConnect.Open();
SqlCommand objCommand = new SqlCommand(strSQL, objConnect); SqlDataReader myReader = objCommand.ExecuteReader(); StringBuilder xmlData = new StringBuilder(); //Generate the chart elementxmlData.AppendFormat(
"<chart caption='Infrastructure Capacity Usage' subCaption='Monthly' xAxisName='Month' yAxisName='Capacity Used' showValues='0' formatNumberScale='0' showBorder='1'logoURL='../images/steelcase-logo.gif' logoPosition='TL' logoAlpha='100' logoScale='100'>"); while (myReader.Read()){
xmlData.AppendFormat(
"<set label='" + myReader["Date"].ToString() + "' value='" + myReader["Used_Cap"].ToString() + "' />");}
myReader.Close();
xmlData.Append(
"<trendLines><line startValue='900' color='FF0033' displayvalue='Max Capacity' /></trendLines></chart>");Response.ContentType =
"text/xml"; //Just write out the XML data //NOTE THAT THIS PAGE DOESN'T CONTAIN ANY HTML TAG, WHATSOEVERResponse.Write(xmlData.ToString());
objConnect.Close();
objConnect.Dispose();
What do i need to do to get that to work with a updatepanel, because when ever it updates it loses the chart and just shows, Chart.
Thanks!
-
I have an exmaple that works when using Literals and return the charts to them to update. Where it goes wrong is when i use the dataurl method.
I am calling the chart to page using: on default.aspx
<%=GetInfrastructureCapacityURL()%>
Code behind page is:
public string GetInfrastructureCapacityURL()
{
String dataURL = Server.UrlEncode("dataURL_Infrasturcture_Capacity.aspx");
//Create the chart - Pie 3D Chart with dataURL as strDataURL
return FusionCharts.RenderChart("../FusionCharts/Column3D.swf", dataURL, "", "FactorySum", "600", "300", false, false);
}
On the data_URL_Infrasturcture_Capacity.aspx this is the code:
string connString = "Data Source=.SQLEXPRESS;AttachDbFilename=|DataDirectory|Inf_Cap.mdf;Integrated Security=True;User Instance=True";
// OLD LINK Data Source=HECND7261TRBSQLEXPRESS;database=TestDatabase; UID=dbtest;PWD=87JamesH
string strSQL = "SELECT TOP 6 Date = CONVERT(varchar(8), Date, 1), Used_Cap " +
"FROM Inf_Cap_Monthly " +
"ORDER BY Date Desc ";
SqlConnection objConnect = new SqlConnection(connString);
objConnect.Open();
SqlCommand objCommand = new SqlCommand(strSQL, objConnect);
SqlDataReader myReader = objCommand.ExecuteReader();
StringBuilder xmlData = new StringBuilder();
//Generate the chart element
xmlData.AppendFormat("<chart caption='Infrastructure Capacity Usage' subCaption='Monthly' xAxisName='Month' yAxisName='Capacity Used' showValues='0' formatNumberScale='0' showBorder='1'logoURL='../images/steelcase-logo.gif' logoPosition='TL' logoAlpha='100' logoScale='100'>");
while (myReader.Read())
{
xmlData.AppendFormat("<set label='" + myReader["Date"].ToString() + "' value='" + myReader["Used_Cap"].ToString() + "' />");
}
myReader.Close();
xmlData.Append("<trendLines><line startValue='900' color='FF0033' displayvalue='Max Capacity' /></trendLines></chart>");
Response.ContentType = "text/xml";
//Just write out the XML data
//NOTE THAT THIS PAGE DOESN'T CONTAIN ANY HTML TAG, WHATSOEVER
Response.Write(xmlData.ToString());
objConnect.Close();
objConnect.Dispose();
What do i need to do to get that to work with a updatepanel, because when ever it updates it loses the chart and just shows, Chart.
Thanks!
-
Nevermind i was pushing XML, but i had the xmlData.ToString in the dataurl.
lol
THank you Jesus for answering my prayers!
-
I am trying to pull a simple database:
tring connString = "Data Source=.SQLEXPRESS;AttachDbFilename=|DataDirectory|Inf_Cap.mdf;Integrated Security=True;User Instance=True";
// OLD LINK Data Source=HECND7261TRBSQLEXPRESS;database=TestDatabase; UID=dbtest;PWD=87JamesH
string strSQL = "SELECT TOP 5 Date AS Date, Used_Cap AS Used_Cap, Available_Cap " +
"FROM Inf_Cap_Monthly " +
"ORDER BY Date Desc " +
"FOR XML AUTO";
SqlConnection objConnect = new SqlConnection(connString);
objConnect.Open();
SqlCommand objCommand = new SqlCommand(strSQL, objConnect);
SqlDataReader myReader = objCommand.ExecuteReader();
StringBuilder xmlData = new StringBuilder();
xmlData.AppendFormat("<chart caption='Infrastructure Capacity Usage' subCaption='Monthly' xAxisName='Month' yAxisName='% Used' showValues='0' formatNumberScale='0' showBorder='1'>");
while (myReader.Read())
{
xmlData.AppendFormat("<set label='{0}' value='{1}' />", myReader["Date"].ToString(), myReader["Used_Cap"].ToString());
}
myReader.Close();
xmlData.Append("</chart>");
//Create the chart with data from xmlData
Literal1.Text = FusionCharts.RenderChartHTML("../FusionCharts/Column3D.swf", xmlData.ToString(), "", "myFirst", "600", "300", false);
objConnect.Close();
objConnect.Dispose();
}
}
}
First is the code even all i need? Second i get a indexoutofrange exception in this area:
while (myReader.Read())
{
xmlData.AppendFormat("<set label='{0}' value='{1}' />", myReader["Date"].ToString(), myReader["Used_Cap"].ToString());
}
Thanks
Ben
Real Time Area Chart
in FusionWidgets XT
Posted · Report reply
Hmm actually I tried this to the real-time area chart and it does not work.
Any ideas?
Thanks!
Ben